
![]() English
English ![]() हिन्दी
हिन्दी ![]() Indonesia
Indonesia ![]() Tiếng Việt
Tiếng Việt ![]() العربية
العربية
Donald Lambert developed the Commodity Channel Index(CCI) in 1980. He made it to determine cyclic turnover in commodities, but later, people recognize it also useful when applied in technical analysis, especially indices, ETFs, stocks, and other securities.
CCI is a versatile momentum oscillator that identifies overbought and oversold levels. Technically, CCI measures the currently closed price relative to an average price over a given number of sessions. Traders could see the current trend in the market and the reversion signal.
CCI calculates the average compared to the statistical standard deviation. The CCI calculation formula will generate values from -300 to +300.
Register Olymp Trade & Get Free $10,000 Get $10,000 free for newbies
CCI formula
Each point of the graph will be calculated as follows:
- Average price = (Closing price + Peak price + Bottom price) / 3
- CCI = (Average price – SMA (Average price)) / (0.015 + standard deviation)
The number of sessions applied to the above formula is usually 14 or 20 to obtain the best efficiency.
CCI oscillator mechanism
CCI oscillator usually moves stably at -100 to 100. In this zone, the trend is not clear, too close to the zero lines. Based on the formula presented above, any deviations over 100 are considered overbought/oversold areas. To describe, we define upper +100 is the overbought area, below -100 is the oversold area.
Overbought and oversold areas tell you that prices are entering a thriving area in a particular direction of development. But no currencies, stocks, or virtual currencies can sustainably develop over a long period of time. Therefore, CCI uses signals at the time the price returns to a stable level as a signal for technical analysis.
How to use the CCI oscillator
The Commodity Channel Index (CCI) can be used as either a coincident or leading indicator. In the case of a coincident indicator, cross above +100 shows a good price can signal the beginning of an uptrend. Diving below -100 indicates a weak price that can signal the start of a downtrend.
As a leading indicator, traders can look for conditions of overbought or oversold that could herald a positive reversal. Similarly, divergence and convergence can be used to detect earlier momentum movements and to predict trend reversals.
Oscillating indicators often encounter problems of delay too much when comparing to the current price. But the CCI indicator updates the market with extremely low latency. Therefore, using CCI in combination with other zero-latency indicators will give the market analysis effect beyond expectation.
Register Olymp Trade & Get Free $10,000 Get $10,000 free for newbies
Reversal signal when CCI returns to the stable zone
The stable zone is the area from -100 to +100. CCI moving in this area cannot determine whether the price will reverse or not. But if CCI runs over below -100 or above +100 (preferably above +150, below -150) then moves into a stable zone, this is a strong signal for a reversion.
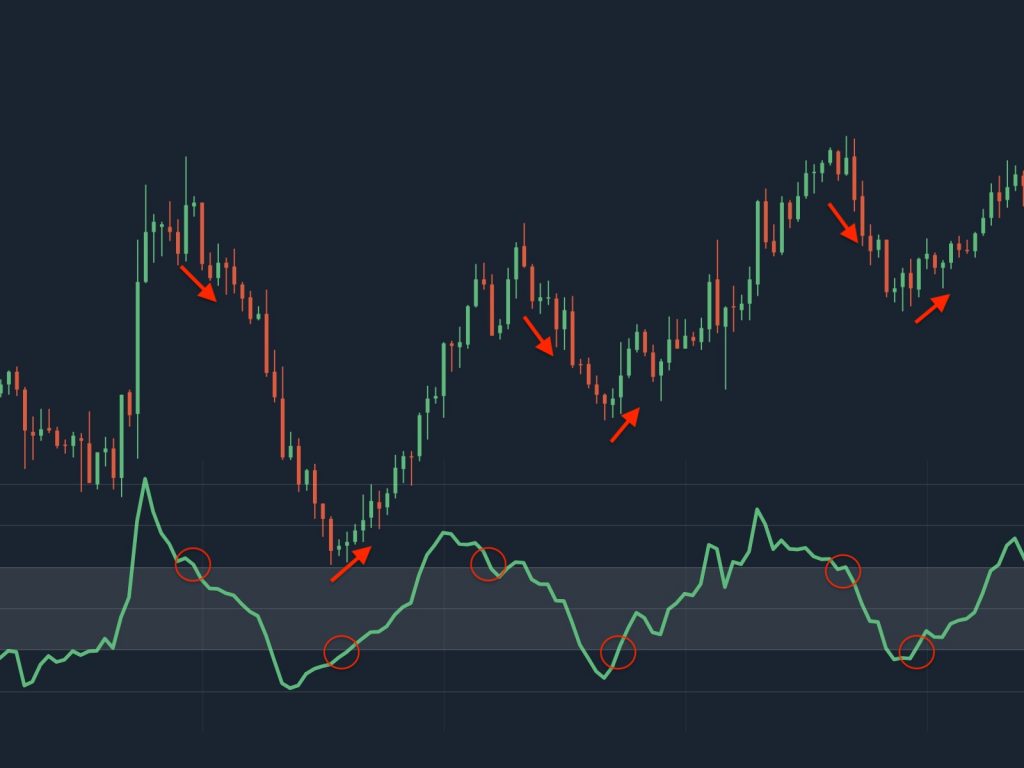
Combine more indicators with CCI signals and place orders for your trades to take profit.
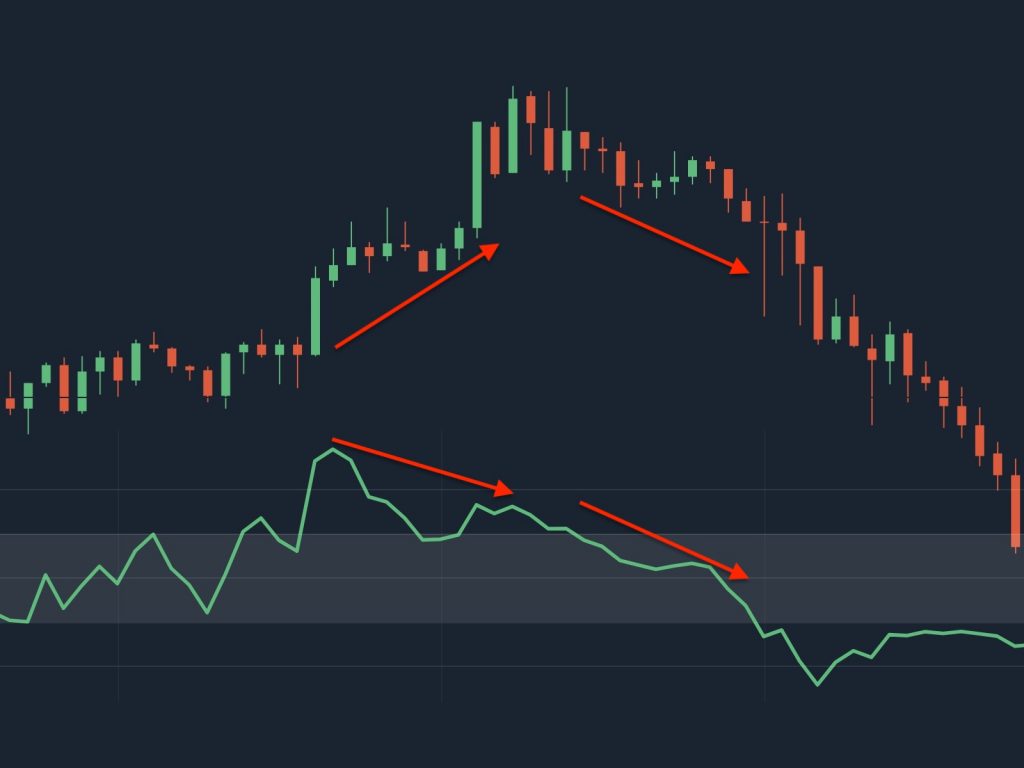
Reversal signal when divergence CCI indicator
CCI divergence is when the price chart moves upwards, but the CCI chart moves downwards, creating a diverging opposing position. Now you need to believe that the trend is going down, the current trend is just a temporary force. This signal indicates that prices will decline soon. To be sure, you still need to use another indicator to combine it to increase accuracy.
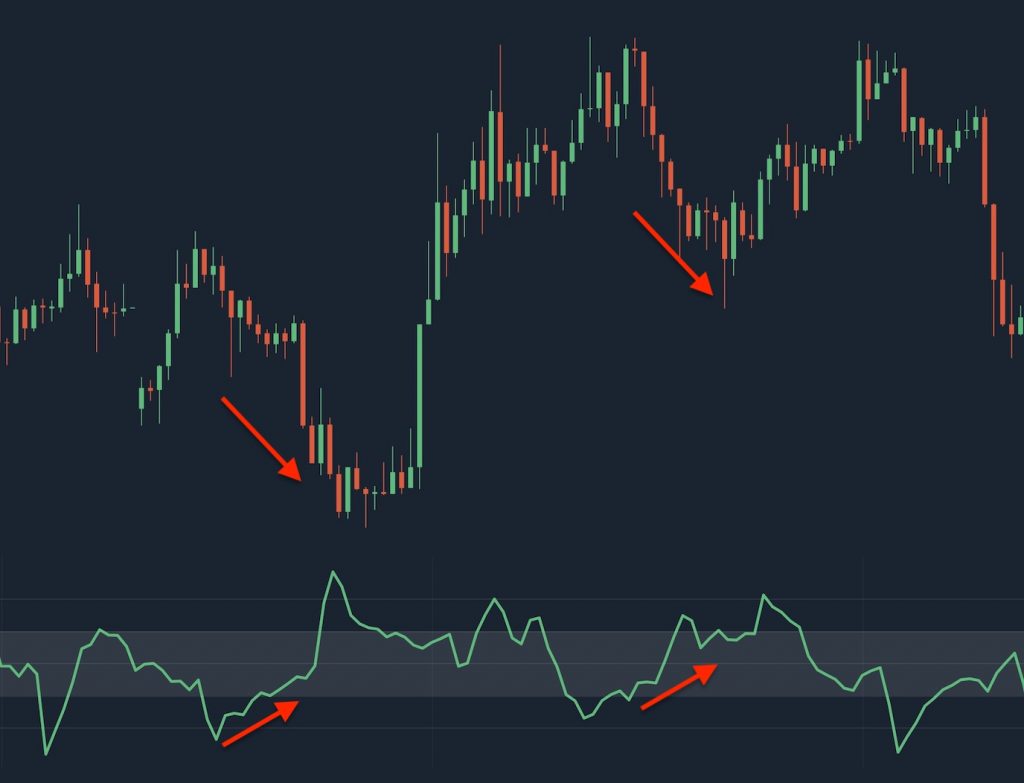
Reversal signal when CCI oscillator converges
CCI convergence is when the price chart moves down, the same time the CCI chart moves up, the two indicators look like they are approaching each other. The indicator shows that the trend is gaining momentum, but the asset is falling, proving that sooner or later, the price will hit bottom and return to the uptrend. Make a trade as soon as this signal is captured.
Notice
Do not forget that any indicator will only give you signals to analyze the market. The more signals you have, the higher your experiences, the lower chance you’ll miss out. The more trading experience you hold, the more unintended situations you can avoid right away before realizing it. So practice combining the use of CCI oscillator with many other indicators like SMA, EMA, MACD, Finabocci, Zigzag, DeM, William% R, Stochastic, Bulls Power & Bears Power, Support & Resistance, RSI, Bollinger Bands, PSAR,…
![]() English
English ![]() हिन्दी
हिन्दी ![]() Indonesia
Indonesia ![]() Tiếng Việt
Tiếng Việt ![]() العربية
العربية


")
 General Risk Notification: Transactions offered by Olymp Trade can be executed only by fully competent adults. Transactions with financial instruments offered on Olymp Trade involve substantial risk and trading may be very risky. If you make Transactions with the financial instruments offered on Olymp Trade, you might incur substantial losses or even lose everything in your Account. Before you decide to start Transactions with the financial instruments offered on Olymp Trade, you must review the Service Agreement and Risk Disclosure Information. Olymp Trade is operated by Saledo Global LLC; Registration number: 227 LLC 2019; Registered Office Address: First Floor, First St. Vincent Bank Ltd Building, P. O Box 1574, James Street, Kingstown, St. Vincent & the Grenadines.