
![]() English
English ![]() हिन्दी
हिन्दी ![]() Indonesia
Indonesia ![]() Tiếng Việt
Tiếng Việt ![]() العربية
العربية
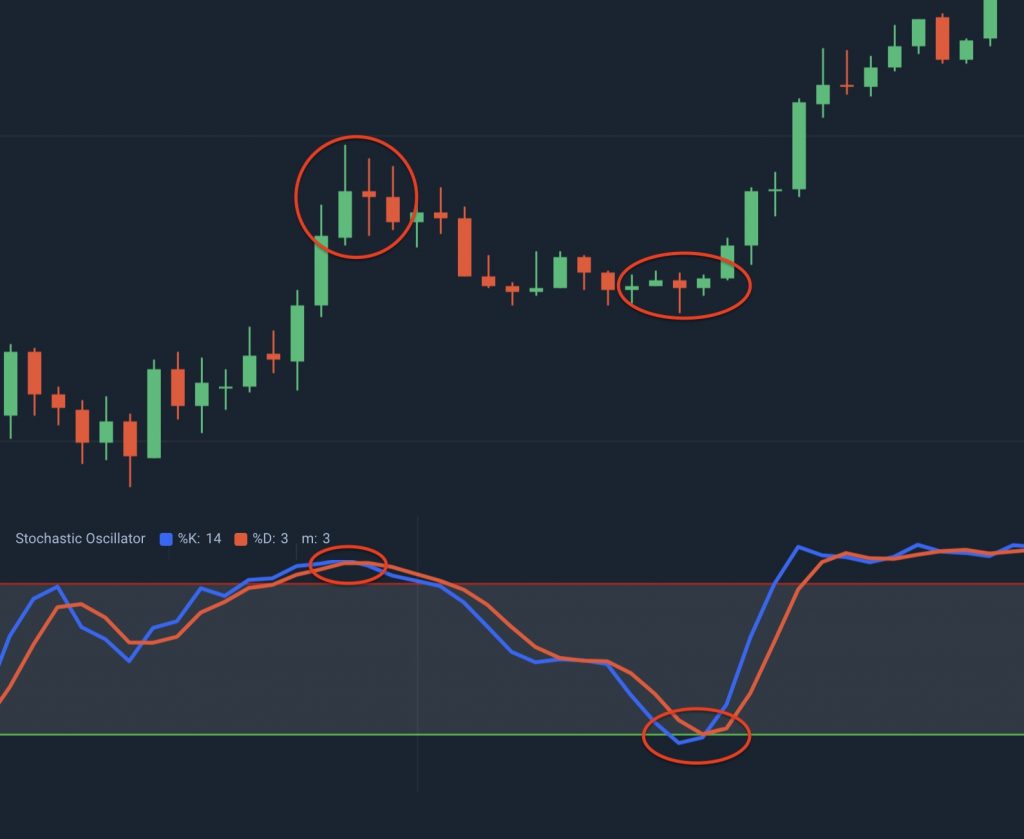
Stochastic Oscillator
Stochastic is an oscillator that measures the fluctuation of asset prices in the range between the highest and lowest level of a fixed period. Research results have shown that it effectively supports predicting when a price will reverse.
The Stochastic oscillator is made up of 2 lines which are %K and %D moving around 0 and 100.
Register Olymp Trade & Get Free $10,000 Get $10,000 free for newbies
Like other oscillators, the %K line and %D line fluctuate between the three regions:
- 0 – 25: The overbought area, because the price is on the way down, the number of market purchases begins to grow excessively. The seller will raise prices to take profits and also to stabilize the market. Predict now the price will start to rise.
- 25 – 75: Stable area, when %D and %K in this zone, it is impossible to predict the market.
- 75 – 100: The oversold area is the opposite of the overbought area. Price growth to a high level, investors predicted not to increase again and decided to take profits. This affects the market price, which is expected to begin to decline at this time.
Stochastic Formula
Just by looking at under formula, you will understand the meaning of the Stochastic oscillator:
% K = [[CLOSE – LOW (n)] / [HIGH (n) – LOW (n)]] * 100%
% D = SMA (% K, n)
Where:
- CLOSE is the current closing price
- n is the number of trading sessions set for the STO oscillator. Typically installed n = 14.
- LOW (n) is the lowest price point in the previous n sessions (excluding CLOSE).
- HIGH (n) is the highest price point of the previous n sessions (excluding CLOSE).
- % D is the SMA line of the % K line with n session settings ( SMA indicator user guide )
Note that LOW and HIGH are bottom and top of n sessions, not CLOSE.
Looking at the formula, we can easily recognize the signal that will take place when the CLOSE price is much different from HIGH (n).
How to use Stochastic oscillator
Buying signal
When the %K line crosses the %D line when moving in the 0 – 25 zone, this is a signal that the price will begin to reverse to increase to enter the stable zone. At this point, you should consider buying.
Selling signal
Conversely, the %K line crosses the %D line while moving within the 75 – 100 zone, which is a price signal that will reverse from upside to downside. At this point, you should sell to take profits.
Combine other indicators
The Stochastic oscillator is quite good to support other indicators like SMA, EMA, MACD to evaluate the time of buying and selling. A good combination can help you in the process of trading on the stock market, currency, virtual currency.
![]() English
English ![]() हिन्दी
हिन्दी ![]() Indonesia
Indonesia ![]() Tiếng Việt
Tiếng Việt ![]() العربية
العربية


")
 General Risk Notification: Transactions offered by Olymp Trade can be executed only by fully competent adults. Transactions with financial instruments offered on Olymp Trade involve substantial risk and trading may be very risky. If you make Transactions with the financial instruments offered on Olymp Trade, you might incur substantial losses or even lose everything in your Account. Before you decide to start Transactions with the financial instruments offered on Olymp Trade, you must review the Service Agreement and Risk Disclosure Information. Olymp Trade is operated by Saledo Global LLC; Registration number: 227 LLC 2019; Registered Office Address: First Floor, First St. Vincent Bank Ltd Building, P. O Box 1574, James Street, Kingstown, St. Vincent & the Grenadines.