
![]() English
English ![]() हिन्दी
हिन्दी ![]() Indonesia
Indonesia ![]() Tiếng Việt
Tiếng Việt ![]() العربية
العربية
Support and Resistance indicators are familiar concepts in Technical Analysis. However, new traders often unidentified support/resistance areas, which are important.
Register Olymp Trade & Get Free $10,000 Get $10,000 free for newbies
Support and Resistance
Support and Resistance are thresholds as a line where prices reverse or slow down before continuing the trend. And it may repeat in the future.
The line graph of Asset Price will run around between:
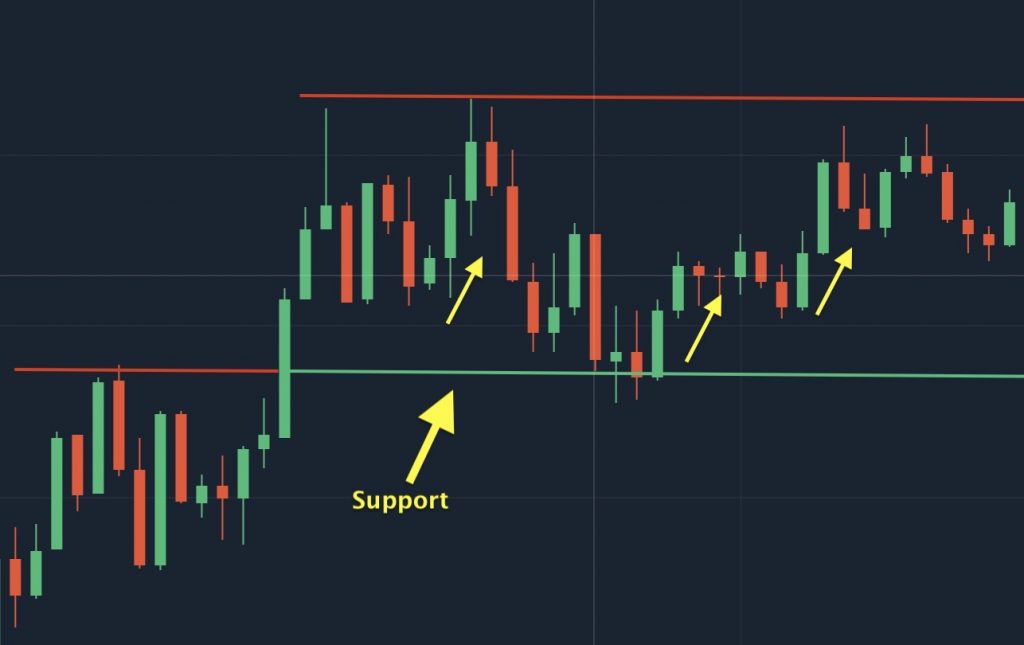
- Support line is determined by the price point where investors expect the price trend to rise. Perhaps because of the general trend of the market, investors buying too much led to pushing the price up. This event repeatedly creates a support threshold as a horizontal line at the bottoms.
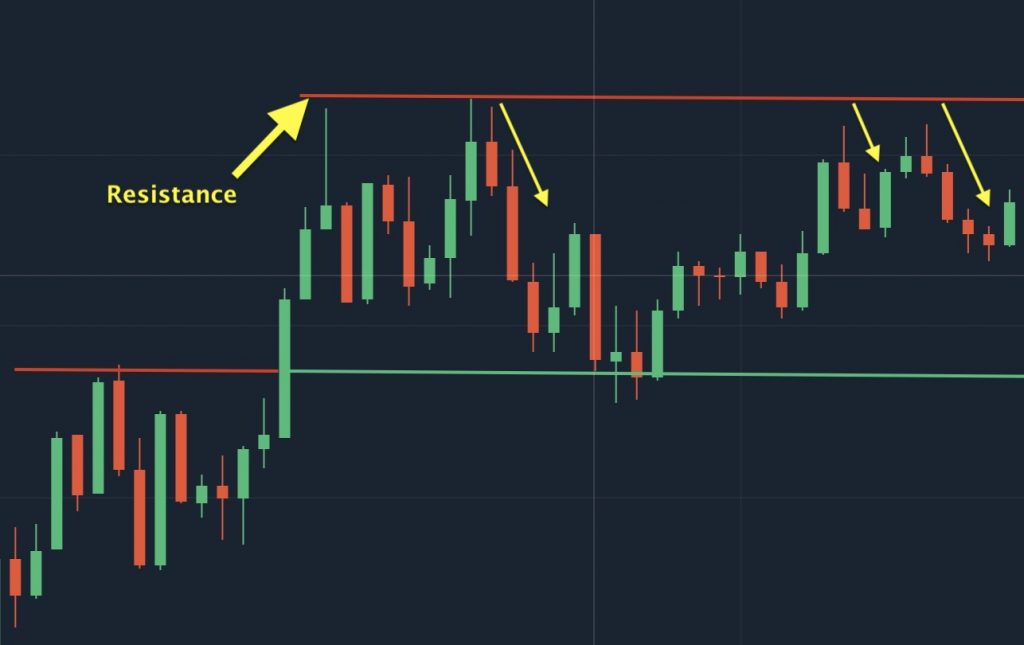
- Resistance threshold is created when a large number of investors predict prices will fall. At that time, selling assets to take profits is the safest. So a number of assets were sold, causing the buy price to decrease to build the balance. Repeated phenomena will create a resistance zone that is a horizontal line at the top.
Strong support/resistance
If a horizontal resistance line passes through multiple peaks, this is a strong resistance line.
Similarly, if a horizontal support line crosses many bottoms, this is a strong support line.
Strong support/resistance means that the price is trending up and down in the support line and resistance line. This will repeat a couple of times in the near future, at this point we can choose the time to buy/sell.
How to trade with support/resistance indicators
The signal when price fall
Price is 90% will reverse when reaching resistance if it is a strong resistance line. This is a good time to sell if you trade Forex, or place a reduced-order if you trade Fixed Time Trade.
The moment of price increase
Similarly, when touching the strong support line, prices are predicted to increase. If trading Fixed Time Trade, you should put an increasing order, or buy if you trade Forex.
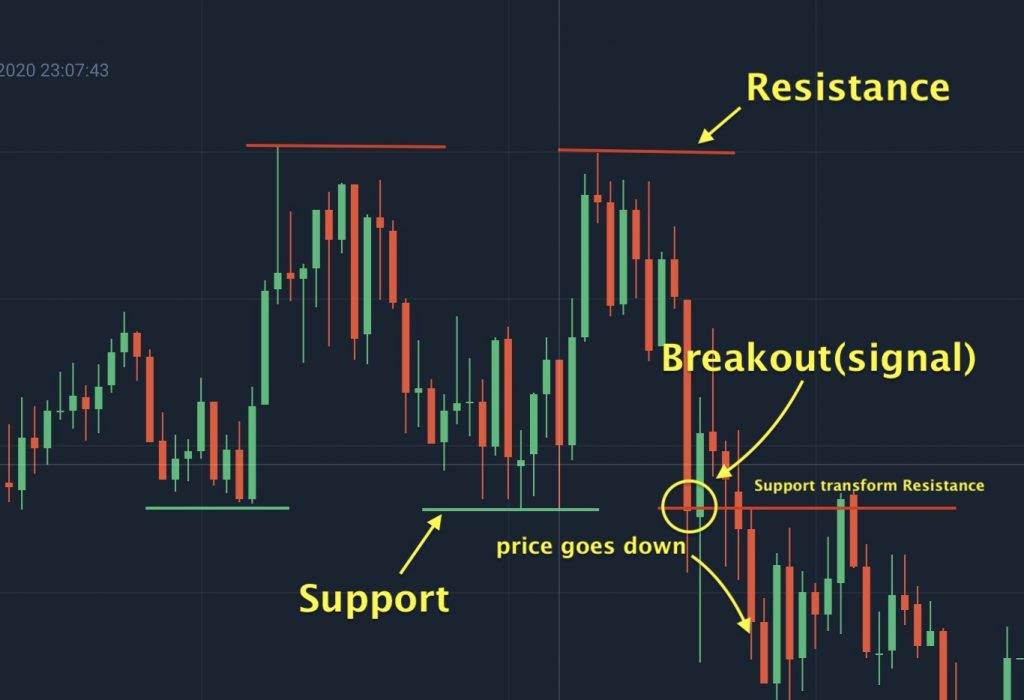
Price exceeds the threshold (Breakout)
The moment the price crosses resistance or support is called a breakout. At this moment:
- If the price breaks above Resistance line to move up, Resistance will turn into Support.
- If the price breaks down Support line to go down, Support will turn into Resistance, creating a new support/resistance area.
Combine other indicators
However, there is always an exception because this is only an indicator to support predictions based on past analysis. To increase the accuracy of your selection, you need to combine many other indicators such as:
- MACD
- Bollinger Bands
- SMA
- EMA
- Bulls Power and Bears Power
- RSI oscillator indicator
- Parabolic SAR
- DeMarker
- Stochastic
Surely you will do well if you master the above factors.
![]() English
English ![]() हिन्दी
हिन्दी ![]() Indonesia
Indonesia ![]() Tiếng Việt
Tiếng Việt ![]() العربية
العربية


")
 General Risk Notification: Transactions offered by Olymp Trade can be executed only by fully competent adults. Transactions with financial instruments offered on Olymp Trade involve substantial risk and trading may be very risky. If you make Transactions with the financial instruments offered on Olymp Trade, you might incur substantial losses or even lose everything in your Account. Before you decide to start Transactions with the financial instruments offered on Olymp Trade, you must review the Service Agreement and Risk Disclosure Information. Olymp Trade is operated by Saledo Global LLC; Registration number: 227 LLC 2019; Registered Office Address: First Floor, First St. Vincent Bank Ltd Building, P. O Box 1574, James Street, Kingstown, St. Vincent & the Grenadines.