
![]() English
English ![]() हिन्दी
हिन्दी ![]() Indonesia
Indonesia ![]() Tiếng Việt
Tiếng Việt ![]() العربية
العربية
Moving Average Convergence Divergence (MACD) is a combination of two single lines those two are designed by Exponential Moving Average (EMA). Traders use MACD to take the signal of bullish or bearish momentum of prices to buy or sell.
What is the MACD indicator?
The MACD (Moving Average Convergence Divergence) is a Convergence and Divergence indicator. The indicator was first described by Gerald Appel in the book Systems and Forecasts, in 1979. Later in 1986, Thomas Aspray added a column chart to MACD and spread it to make it more popular.
This indicator is very common in data analysis. It allows you to predict the trend of price movements such as the time of ending the trend, reversing, accelerating, decelerating, starting a new trend. Therefore, it is very popular among investors.
Register Olymp Trade & Get Free $10,000 Get $10,000 free for newbies
Composition of the MACD indicator
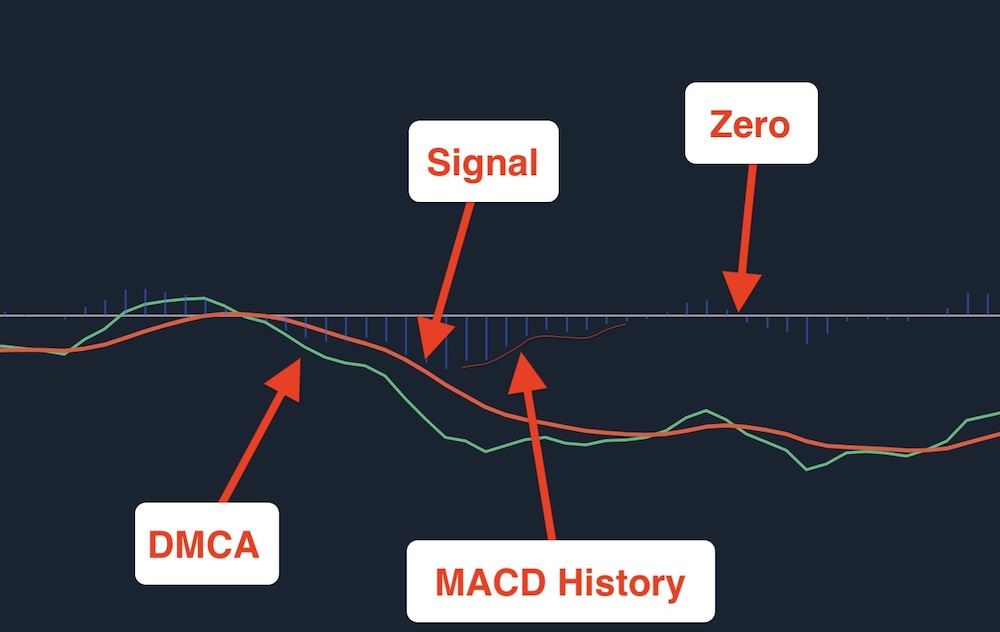
The MACD indicator consists of 4 separate components:
- MACD line: The difference of EMA-26 (*) and EMA-12 (**) with the formula MACD = EMA-26 – EMA-12
- The Signal: The exponential moving average of the previous nine sessions called 9-EMA.
- MACD History: This is the difference taken from the MACD line minus the Signal line.
- Zero line: line of 0 in the middle.
EMA stands for Exponential Moving Average, where:
(*) The exponential moving average of the previous 26 sessions.
(**) The exponential moving average of the previous 12 sessions
How to use the MACD indicator
MACD is a trend indicator based on the line chart, so it is easy to understand and use. Investors often combine this MACD with a number of other indicators, such as the Bollinger Bands indicator to identify trends more accurately.
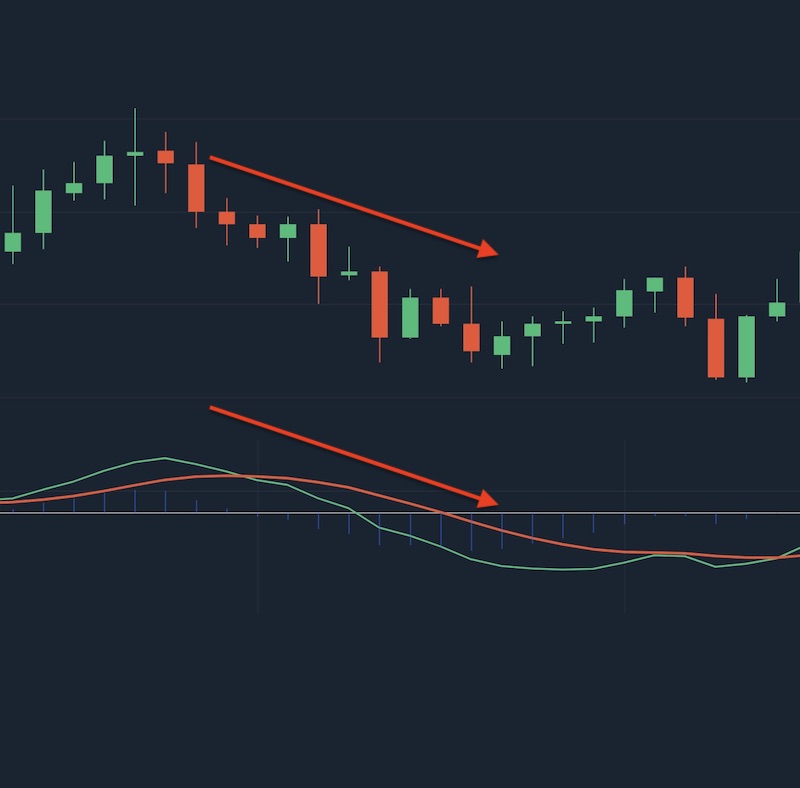
The MACD cross the Signal line
Signals by Signal line is the most commonly used signal and is also very useful. This is a moment to buy/sell, and it depends on the direction of the MACD:
- The MACD line is touching the signal of an upward signal: The signal shows that the price trend is increasing, the moment of buying.
- The MACD is ticking the Signal line downward: The signal that the trend is down, so sell right now to take the profit.
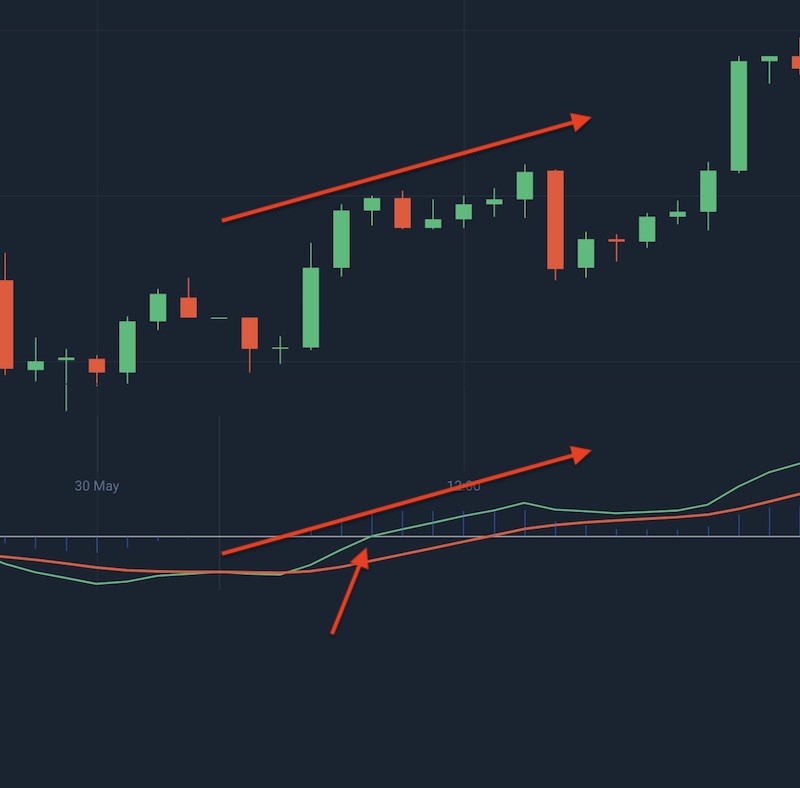
MACD crosses Zero line
Similar to crossing Signal line, MACD crossing Zero line also shows one of the following two trends:
- The MACD crosses the Zero line in an upward direction: it is a signal that the price is moving up.
- The MACD crosses the Zero line in the downward direction: it is a signal that the price is in the downtrend.
Signs of convergence and divergence – signs of price reversal
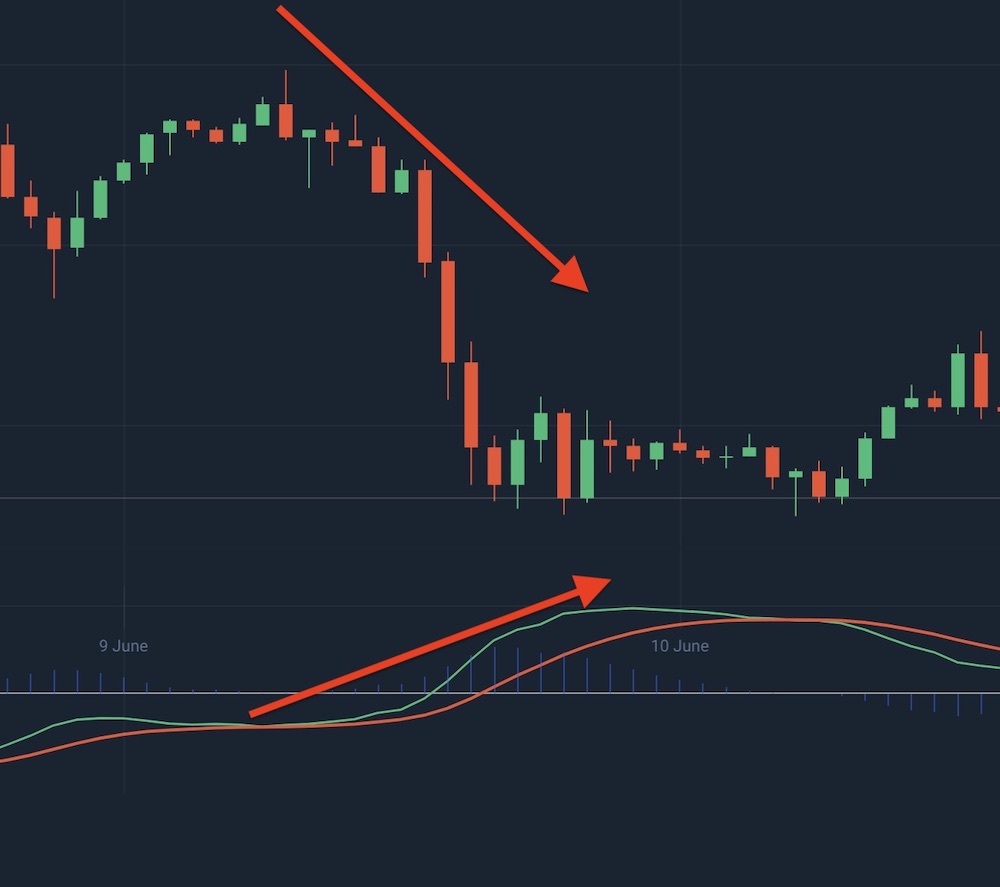
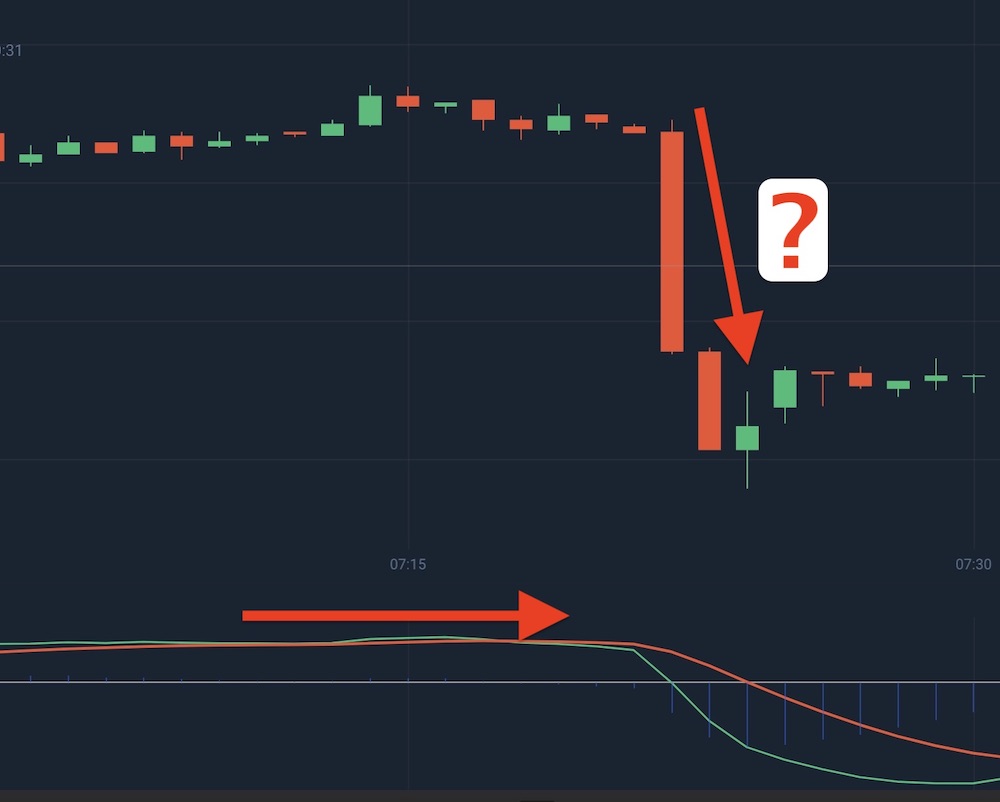
Signal of convergence
- This occurs when the MACD is rising, but the price graph is down.
- The price chart is falling, but because the oscillation is not strong enough to accelerate down, it is also hesitant. Indicates a signal that price is about to change direction.
- This is the golden time to buy the assets.
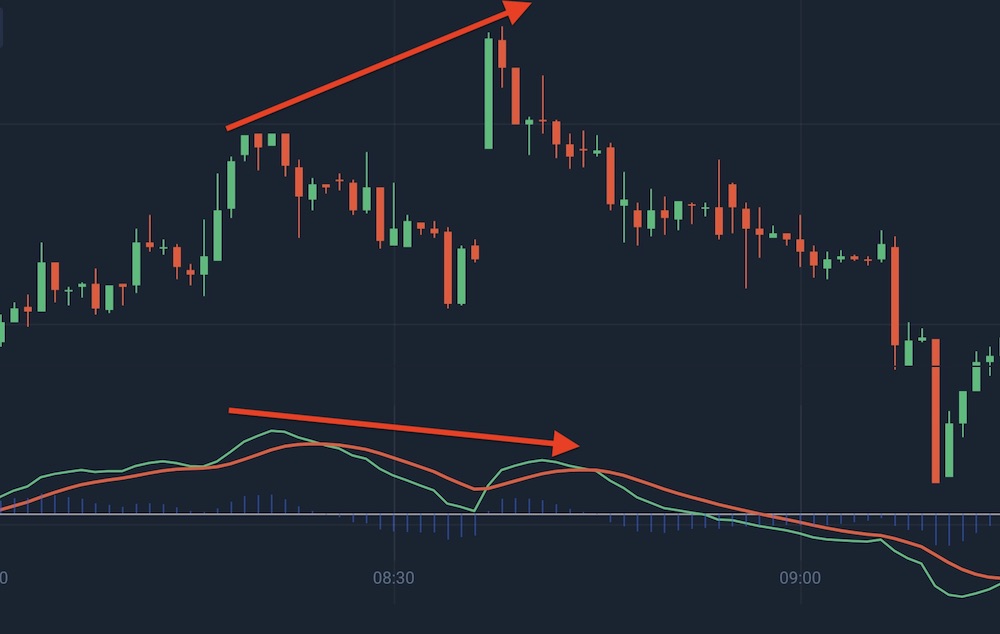
Signal for divergence
- Divergence is the phenomenon of two lines separated from each other. This is a phenomenon where the price chart goes up, but the MACD line goes down.
- Similar to the Convergence, the market has not enough motivation to push prices up, so it is still hesitant.
- 90% is the time to sell for profit.
Note about the MACD indicator
Any chart has limitations or advantages in certain situations. So there are still many things to keep in mind when trading on the MACD indicator to avoid losing all.
Register Olymp Trade & Get Free $10,000 Get $10,000 free for newbies
Short-term MACD signal
The effectiveness of MACD reaches its peak in moderate time and short time. EMA-26, EMA-12, EMA-9 is the ratio of the number of sessions to achieve the most effectiveness. You can completely change it to another ratio, for example, EMA-18, EMA-8, EMA-6. Or you can increase or decrease the time of each session to get the MACD line that you think is most reasonable.
Remember that the MACD is not suitable for long-term signals.
Signal is interference
Remember that indicators are also just a means for you to analyze data, to increase the probability of success exceeding 50%. Because the probability problem is based on historical data, the indicator transaction can also be wrong in an instant when it encounters abnormal interference, such as Bitcoin dropping $2000 in just a few minutes. It is important to always set a stop loss when to control trading.
Analysis by combines many different indicators
The more indicators and tactics used together, and the more accurate the buy / sell probability. This is a basic indicator for newbies if you can, you should learn more advanced indicators.
![]() English
English ![]() हिन्दी
हिन्दी ![]() Indonesia
Indonesia ![]() Tiếng Việt
Tiếng Việt ![]() العربية
العربية


")
 General Risk Notification: Transactions offered by Olymp Trade can be executed only by fully competent adults. Transactions with financial instruments offered on Olymp Trade involve substantial risk and trading may be very risky. If you make Transactions with the financial instruments offered on Olymp Trade, you might incur substantial losses or even lose everything in your Account. Before you decide to start Transactions with the financial instruments offered on Olymp Trade, you must review the Service Agreement and Risk Disclosure Information. Olymp Trade is operated by Saledo Global LLC; Registration number: 227 LLC 2019; Registered Office Address: First Floor, First St. Vincent Bank Ltd Building, P. O Box 1574, James Street, Kingstown, St. Vincent & the Grenadines.