
![]() English
English ![]() हिन्दी
हिन्दी ![]() Indonesia
Indonesia ![]() Tiếng Việt
Tiếng Việt ![]() العربية
العربية
What is the RSI indicator?
The Relative Strength Index (RSI) is a type of oscillator indicator used to alert trends that are about to begin to reverse.
Basically, the RSI can show the market is oversold or overbought, to catch trend-related signals. Although it is a basic indicator, it is still used by many professional investors because of its effectiveness, increasing the high prediction rate when combining many other indicators.
Register Olymp Trade & Get Free $10,000 Get $10,000 free for newbies
How to calculate RSI
Formula: RSI = 100- [100 / (1 + RS (N))]
Where:
- RS (N) is the total number of increase/decrease times in the previous N sessions.
- By default, the RSI is calculated with N = 14 giving the best results.
According to this formula, the RSI is in a range from 0 to 100.
How to use the RSI indicator
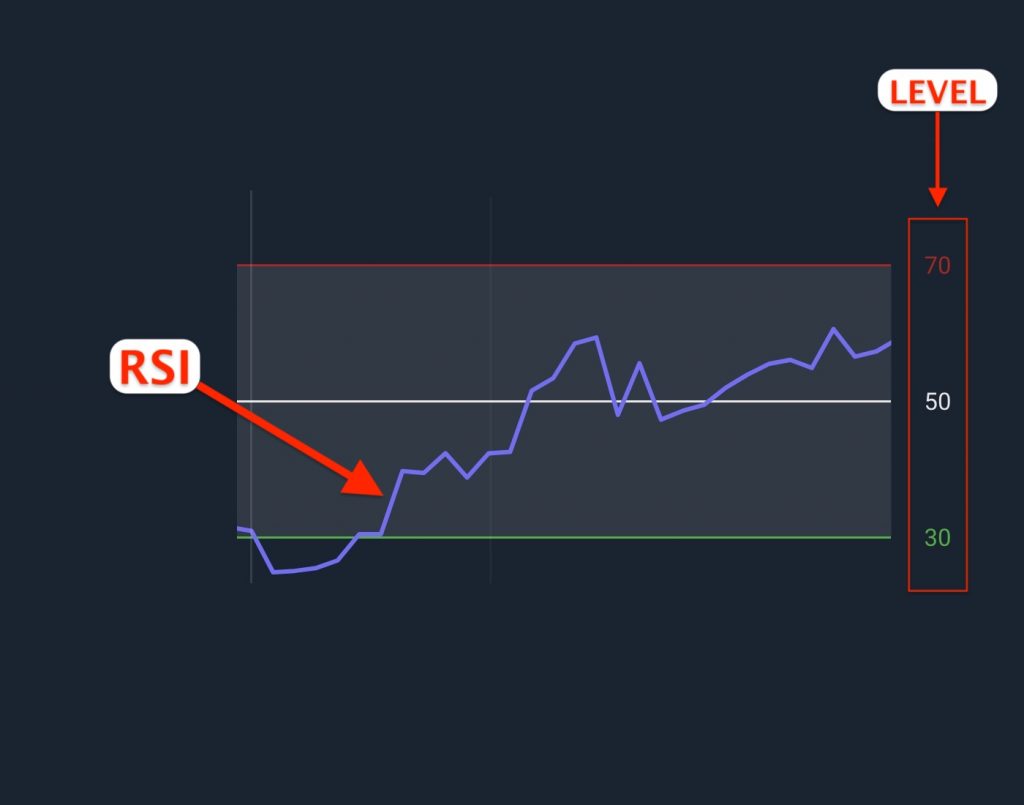
RSI is an indicator graph with one line running from 0 to 100, similar to the DeMarker indicator (https://traderrr.com/demarker-dem-indicator-the-defines-and-how-to-use/). Oscillator indicators type is usually divided into three areas: overbought, oversold, and trading. In which RSI has:
- The oversold area is between 30 and 0. When the RSI enters this zone, the selling is dominating.
- The overbought area ranges from 70 to 100. The oscillation of RSI in this zone show buyer is larger.
- The trading range from 30 to 70 is the balance zone, and traders rarely rely on this signal to trade.
It does not matter whether the RSI is in the overbought or oversold zone until you catch the signals indicating the possibility of a trend reversal.
Signals
Signal of a reversal into the trading range
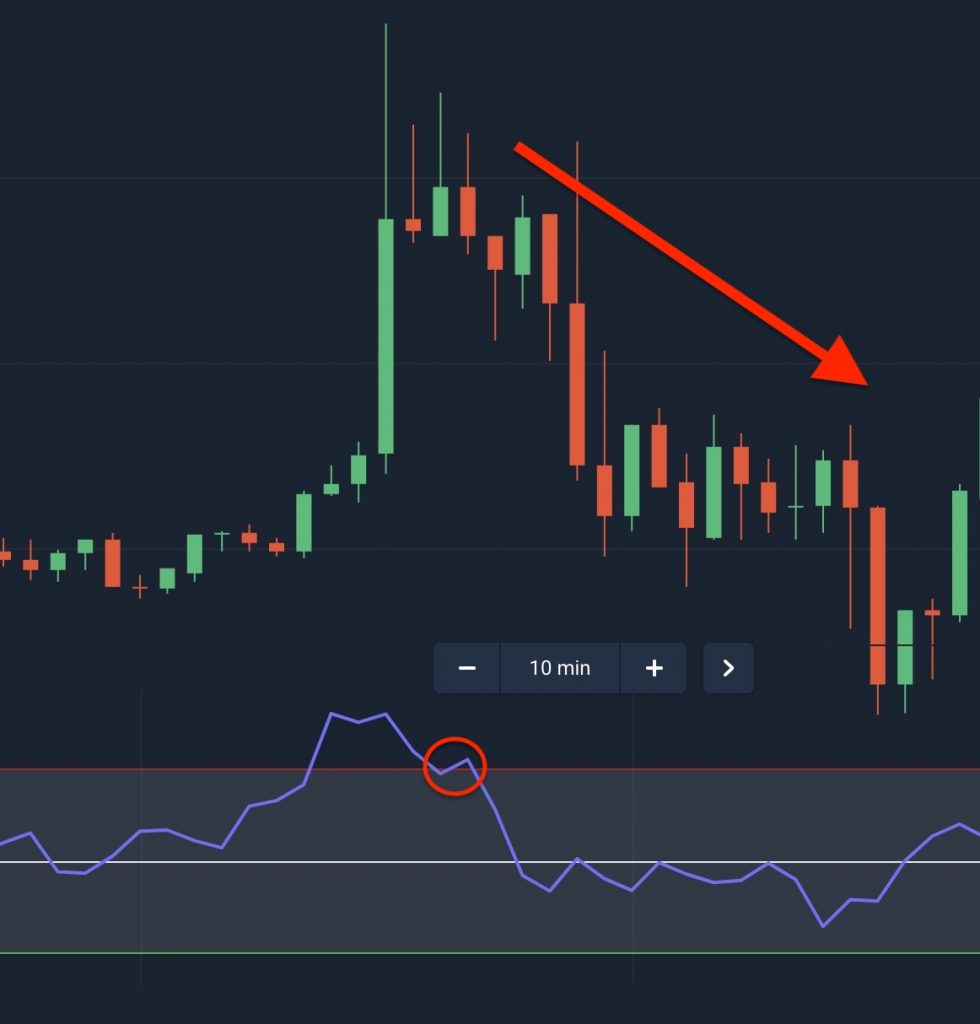
When the RSI is in the overbought area or oversold area, it suddenly turns sharply into the trading range. This is the time to show that the price increase/decrease is currently about to reverse:
- When the RSI runs from the overbought area of 70-100 and returns to the 30-70 area, this is the time to show that the strong uptrend will become slow and may reverse to decrease. At this point, you should open a downtrend order.
The overbought signal by RSI Indicator, you should sell your assets - Similarly, the RSI runs from the oversold area 30-0 and back into the 30-70 show that the time of the downward trend will no longer be strong and may reverse to increase.
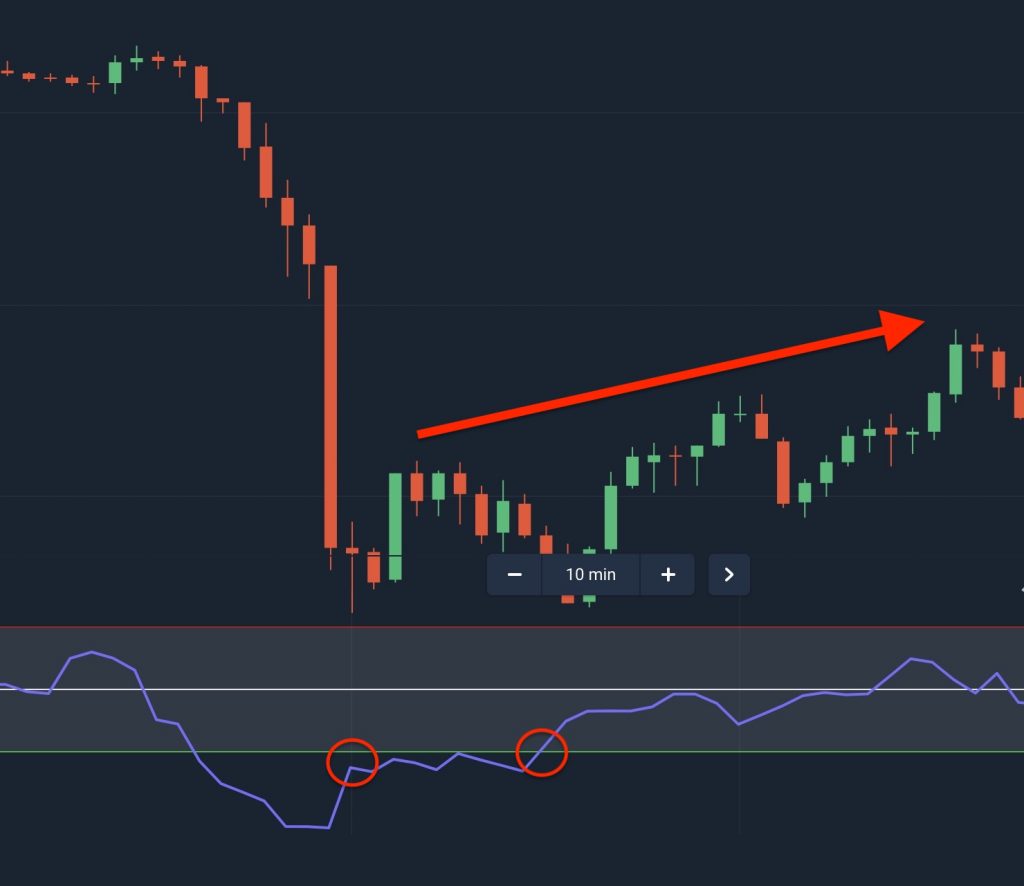
The oversold signal by RSI Indicator, time for buying a new asset
If you catch this signal by combining it with other indicators such as DeMarker, MACD, SMA, … the ability to predict the trend will increase.
The diverging, converging signal of the RSI indicator
The diverging, converging is a reliable signal of up to 90% when a divergence, convergence appears, and the price will begin to reverse from up to down or vice versa.
This signal can be used in all three areas of the RSI, but when the price is in the overbought/oversold zone, the prediction is accurate to be 95%.
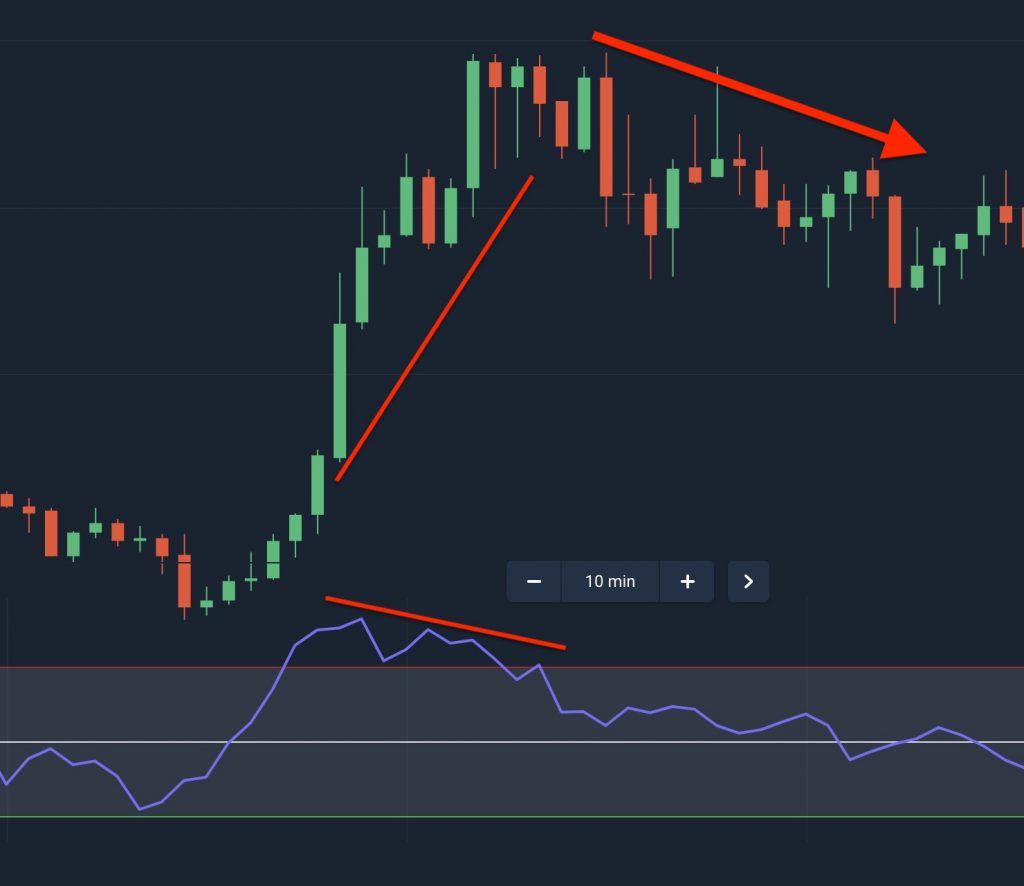
The moment the RSI goes against the price chart will create a reversal moment:
- Convergence RSI Bullish: The price chart created a new bottom, while the RSI reversed to increase, generating a convergence signal, indicating the price trend reversal signal. If the RSI is in the oversold zone, this signal is sure to 95%.
- RSI Bearish divergence: The price chart creates a higher peak, while the RSI creates a downtrend line. Which produces a divergence signal, indicating that the trend will reverse to the downside. If the RSI is in the overbought area, this signal is sure to 95%.
Note
Professional traders usually trade RSI with a low number of sessions, and the duration of each session is between 5 minutes and 20 minutes will give the best results. If you want to trade for the long-term, you should combine it with many other indicators for better analysis.
Register Olymp Trade & Get Free $10,000 Get $10,000 free for newbies
![]() English
English ![]() हिन्दी
हिन्दी ![]() Indonesia
Indonesia ![]() Tiếng Việt
Tiếng Việt ![]() العربية
العربية


")
 General Risk Notification: Transactions offered by Olymp Trade can be executed only by fully competent adults. Transactions with financial instruments offered on Olymp Trade involve substantial risk and trading may be very risky. If you make Transactions with the financial instruments offered on Olymp Trade, you might incur substantial losses or even lose everything in your Account. Before you decide to start Transactions with the financial instruments offered on Olymp Trade, you must review the Service Agreement and Risk Disclosure Information. Olymp Trade is operated by Saledo Global LLC; Registration number: 227 LLC 2019; Registered Office Address: First Floor, First St. Vincent Bank Ltd Building, P. O Box 1574, James Street, Kingstown, St. Vincent & the Grenadines.