
![]() English
English ![]() हिन्दी
हिन्दी ![]() Indonesia
Indonesia ![]() Tiếng Việt
Tiếng Việt ![]() العربية
العربية
Parabolic SAR indicator
Created by Welles Wilder, who authored the RSI indicator, the PSAR indicator is considered one of the core indicators for technical analysis software.
The Parabolic SAR (PSAR) indicator is used to monitor the trend of the asset’s rising/falling trend and also forecasts the price reversal. Although the accuracy is not good because of its simplicity, the combination of other indicators and PSAR is essential for a trader regardless of profession or newbie.
Register Olymp Trade & Get Free $10,000 Get $10,000 free for newbies
Description of PSAR indicator
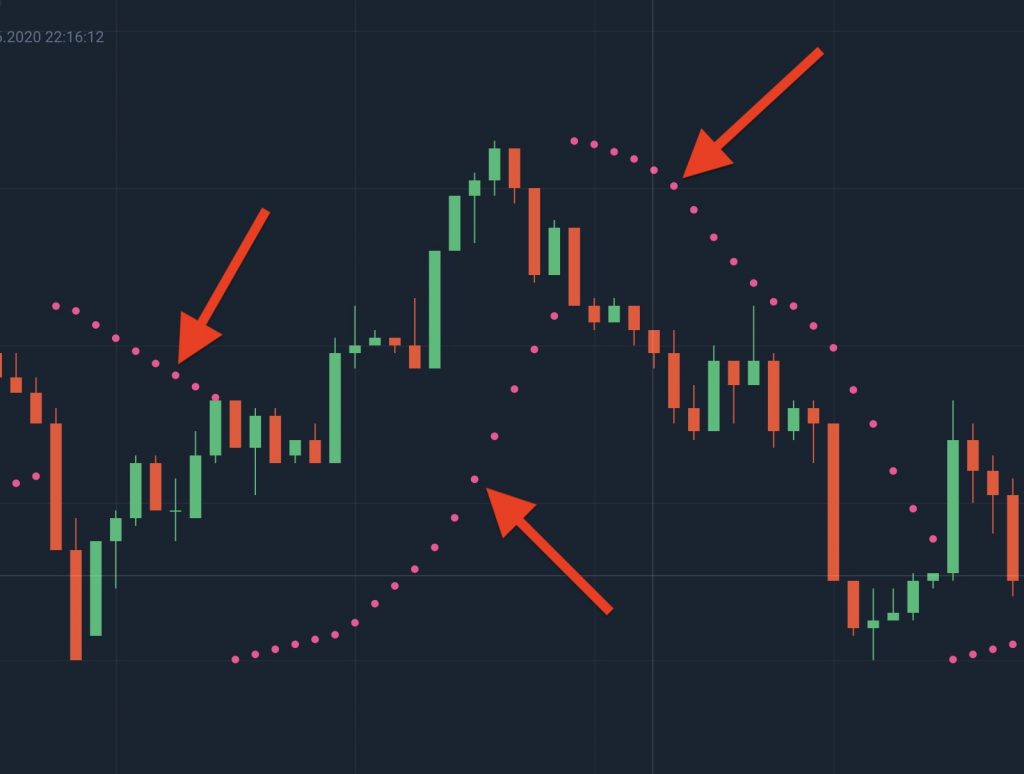
The PSAR indicator is shown as a line below the chart or lines above the chart, interrupted repetitively. When above, the line tends to go down, the price of the trend is down too. Conversely, when below, the line tends to go up, prices tend to rise.
How to calculate the PSAR indicator
PSAR (n) = PSAR (n-1) + AF * (EP – PSAR (n))
WHERE:
- PSAR (n) is the value of the current PSAR
- PSAR (n-1) is the value of the previous PSAR
- EP (Extreme Price) is the culmination of a trend. For example, the EP will be the highest price of an uptrend and be the lowest price of the downtrend.
- AF (Acceleration Factor) is the acceleration constant of the PSAR formula. Within the range of 0.02 to 0.20. Every time a new EP peak is obtained, the AF will increase to 0.02 to a maximum of 0.20.
Parabolic SAR indicator entry signal
PSAR is weak
When the PSAR line shows signs of a horizontal line, it is difficult to reverse the price.
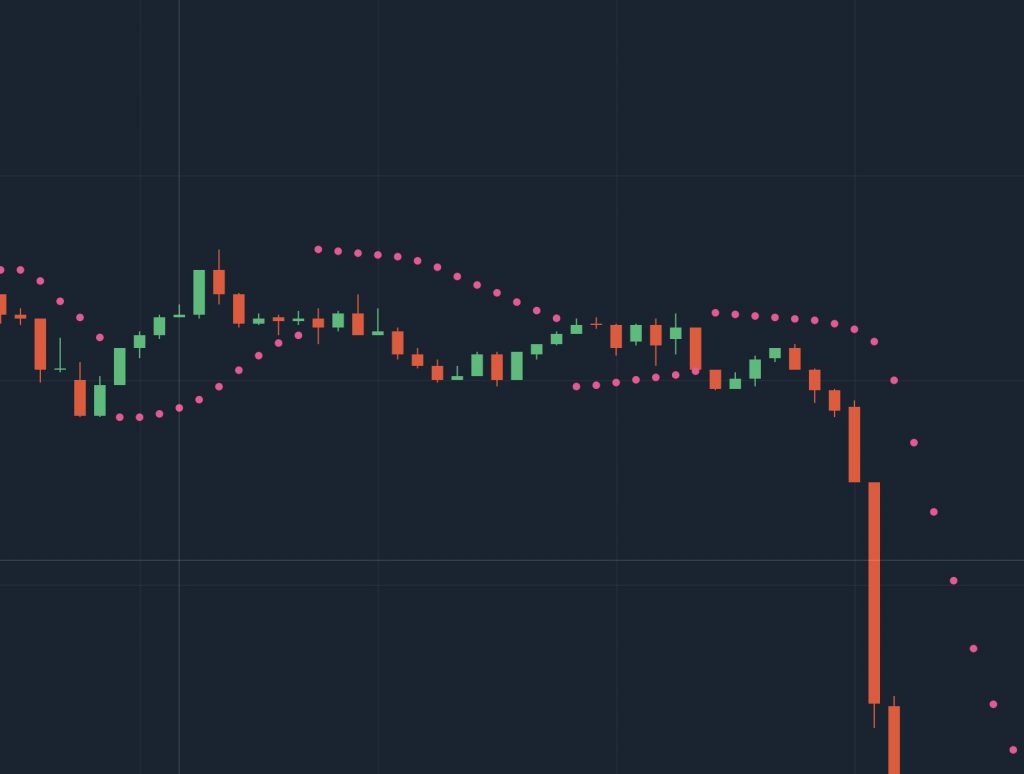
PSAR reversed sharply
Signals when the Parabolic SAR indicator is rising or down steadily, suddenly reversing to the opposite by 2-3 points with a sharp slope, this is a signal that announces prices will reverse.
Combine the Support / Resistance indicator
The PSAR indicator will work well with the Support / Resistance lines to increase accuracy. If captured well, just 2 indicators and feeling into your luck, you can make money better.
It is good that PSAR tends to fall while staying under the resistance line, which is a good sign that the price will fall.
And vice versa, when PSAR tends to rise while it is on the support line, it is a signal that prices will rise.
Create compound indicators
A combination of DeMarker, RSI, Bollinger Bands, or any other simple indicators brings higher accuracy. If you are new, at this level you will understand the trend when using simple indicators at the same time. When you are already professional, you will combine the advanced indicators.
Note
PSAR is a pocket indicator, but it only works when opening positions for a long time. If you are dealing with a short time frame, consider running with more indicators than usual to increase accuracy. Although more indicators mean you have to have more analytical skills.
Register Olymp Trade & Get Free $10,000 Get $10,000 free for newbies
![]() English
English ![]() हिन्दी
हिन्दी ![]() Indonesia
Indonesia ![]() Tiếng Việt
Tiếng Việt ![]() العربية
العربية


")
 General Risk Notification: Transactions offered by Olymp Trade can be executed only by fully competent adults. Transactions with financial instruments offered on Olymp Trade involve substantial risk and trading may be very risky. If you make Transactions with the financial instruments offered on Olymp Trade, you might incur substantial losses or even lose everything in your Account. Before you decide to start Transactions with the financial instruments offered on Olymp Trade, you must review the Service Agreement and Risk Disclosure Information. Olymp Trade is operated by Saledo Global LLC; Registration number: 227 LLC 2019; Registered Office Address: First Floor, First St. Vincent Bank Ltd Building, P. O Box 1574, James Street, Kingstown, St. Vincent & the Grenadines.