
![]() English
English ![]() हिन्दी
हिन्दी ![]() Indonesia
Indonesia ![]() Tiếng Việt
Tiếng Việt ![]() العربية
العربية
Williams %R Oscillator
Williams %R is an oscillator type mainly looking for overbought and oversold points of the market.
The analysis and usage of Williams %R are actually similar to the Stochastic indicator if you have learned.
However, this indicator will be different from Stochastic in the calculation formula, so their graphs and signals will be different.
Register Olymp Trade & Get Free $10,000 Get $10,000 free for newbies
Williams %R Formula
W_R = [[HIGH (n) – CLOSE] / [HIGH (n) – LOW (n)]]
Inside:
- n is the customizable number of sessions for the Williams %R formula. By default, n is always 14.
- HIGH (n) is the price of the highest peak during the previous n sessions.
- LOW (n) is the price of the lowest bottom during the previous n sessions.
- CLOSE is the closing price of the calculated session.
How to use the Williams %R
Register Olymp Trade & Get Free $10,000 Get $10,000 free for newbies
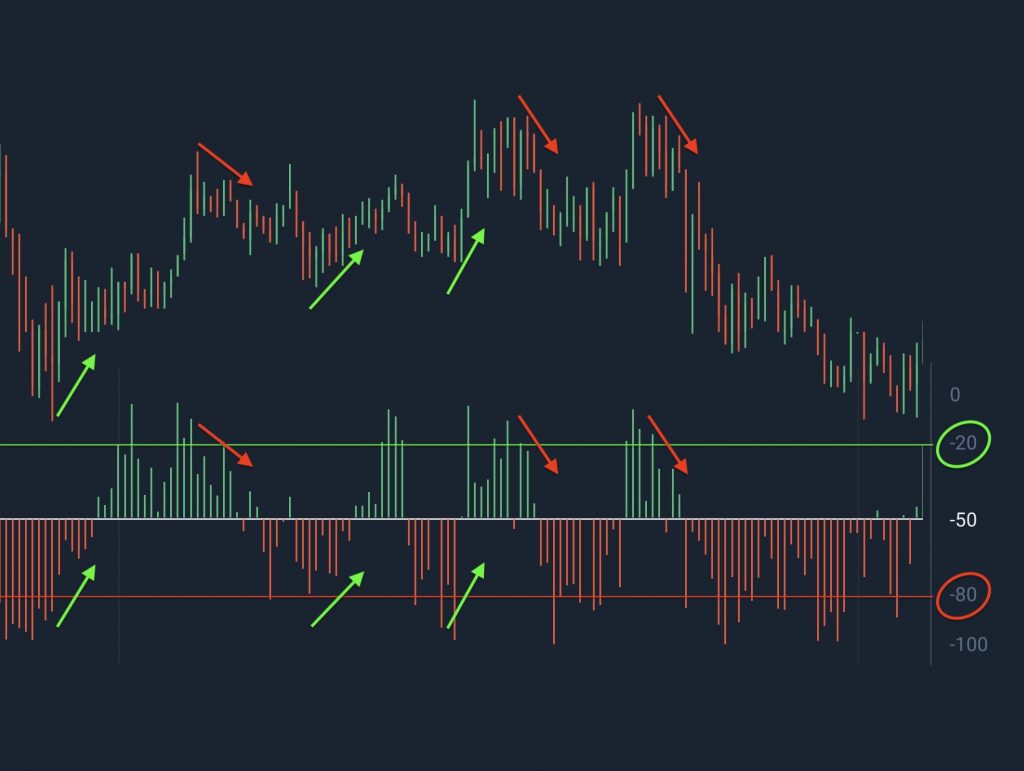
Three oscillating regions capture the signal
The Williams %R indicator moves in the negative zone from 0 to -100, in contrast to Stochastic. It uses the relationship between the highest peak and the current price during fixed sessions to determine overbought and overbought levels. The Williams %R line moves in the following 3 regions:
- From -100 to -80, prices will show signs of a reversal to increase, this is called the oversold zone. You need to buy it now when the time is right.
- From about -80 to -20, the price does not change, this area is called the stable area. Traders cannot predict the price’s path.
- From about -20 to 0, this is an overbought area, the price will reverse to decline. You need to find a reasonable selling time before price reverses.
What is the difference between the Williams %R indicator and the Stochastic indicator?
The two indicators are almost opposite in the analysis if you only look at the formula.
Williams %R
First, the Williams %R indicator ranges from -100 to 0 and represents the correlation between market closing prices and the Resistance.
Stochastic
Stochastic is moving in the range from 0 to 100, showing the relationship between the market closing price and the Support.
Read the Support and Resistance indicator at https://traderrr.com/support-and-resistance-how-to-find-and-how-to-use-it/
Limitations of the Williams %R indicator
The Williams %R indicator tells you if prices are at overbought or oversold levels but that doesn’t mean they will reverse.
However, the signal of overbought is still a confirmation of an uptrend, while oversold, it confirms a downtrend. Based on that and other indicators you can still choose the optimal trade.
![]() English
English ![]() हिन्दी
हिन्दी ![]() Indonesia
Indonesia ![]() Tiếng Việt
Tiếng Việt ![]() العربية
العربية


")
 General Risk Notification: Transactions offered by Olymp Trade can be executed only by fully competent adults. Transactions with financial instruments offered on Olymp Trade involve substantial risk and trading may be very risky. If you make Transactions with the financial instruments offered on Olymp Trade, you might incur substantial losses or even lose everything in your Account. Before you decide to start Transactions with the financial instruments offered on Olymp Trade, you must review the Service Agreement and Risk Disclosure Information. Olymp Trade is operated by Saledo Global LLC; Registration number: 227 LLC 2019; Registered Office Address: First Floor, First St. Vincent Bank Ltd Building, P. O Box 1574, James Street, Kingstown, St. Vincent & the Grenadines.