 Indicator Define and how to use")
![]() English
English ![]() हिन्दी
हिन्दी ![]() Indonesia
Indonesia ![]() Tiếng Việt
Tiếng Việt ![]() العربية
العربية
What is the EMA indicator?
The Exponential Moving Average (EMA) belongs to Moving Average technique, its popularity comparable to the SMA. The EMA indicates whether the market is trending up, down, or stable.
Both the SMA and the EMA are fundamental and essential technical analysis indicators, but the EMA is a little more efficient because of the ability to ignore past volatility, focusing more on the current fluctuations. By weighting, the EMA does overcome the slow response to the volatility of the SMA.
Register Olymp Trade & Get Free $10,000 Get $10,000 free for newbies
Formula
EMA (n) = (CLOSE (n) * K) + (EMA (n-1) * (1 – K))
Inside:
- K = 2 ÷ (n + 1)
- n: number of trading sessions for EMA calculation.
- CLOSE (n): The closing price of the current session
- EMA (n-1): Previous EMA value
- EMA (n): Current EMA value
Characteristics of the EMA
Through the formula, we can see that the new point of EMA is less dependent on the old EMA because it is multiplied by the constant (1-K). By combining many EMAs with different weighted K, we can assess the market. Typically, the common formula of Trader is to use EMA-4, EMA-9, EMA-18 together to capture reverse signals.
The EMA has an advantage over the SMA because its mechanism gives high priority to current values over the past. The second benefit is a reduction in the influence of past random mutations which increases the stability of current EMA.
How to choose the number of sessions and session time
The EMA is very limited for a short time, so players often choose the session such as a day while choosing the number of sessions of the EMA formula is around 5-15. Within this range, the EMA will be most accurate based on the experiences of the trader community.
If you still want to trade in the short-term, you should choose the number of sessions greater than 10 combined with trading sessions counted by minutes.
Signal of the EMA indicator
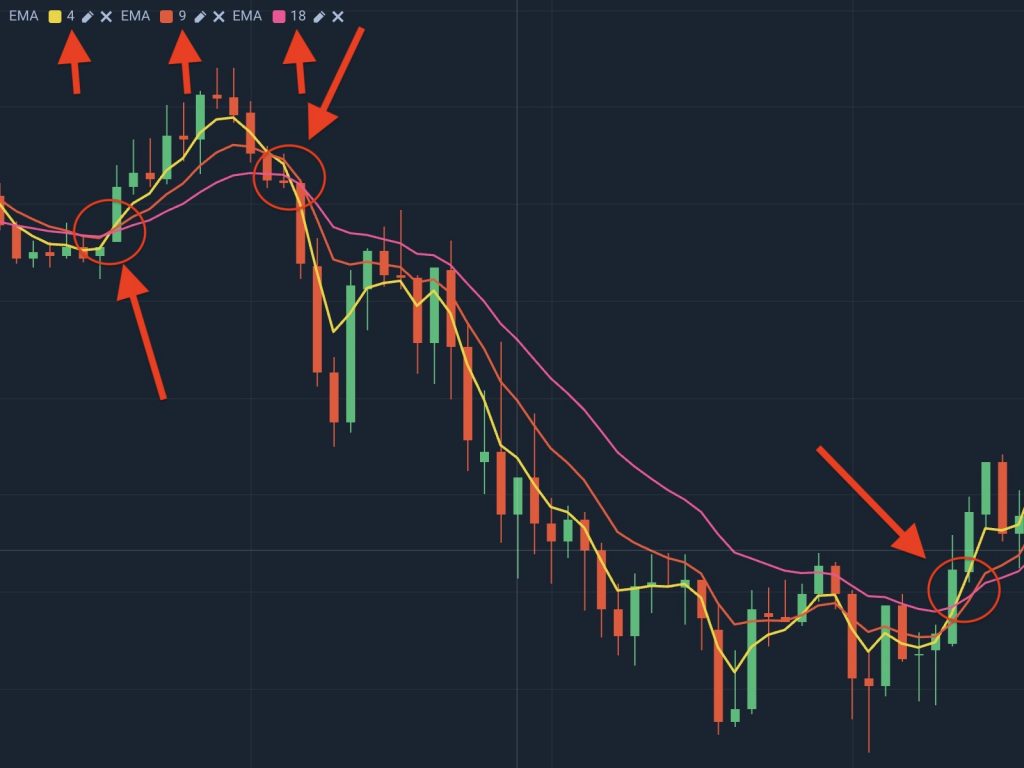
Use a combination of three EMAs
You can use EMA-4, EMA-9, EMA-18, or any other EMA trio to capture signals. The signal is very simple, at the intersection of the three EMAs:
- Three EMAs cross each other during heading down, which is a signal that the price is about to start falling, this time it should be sold because the price is at the peak.
- Three EMAs meet when the price is rising, which is announcing the price is about to rise. At this time it is recommended to buy on or enter the bullish order.
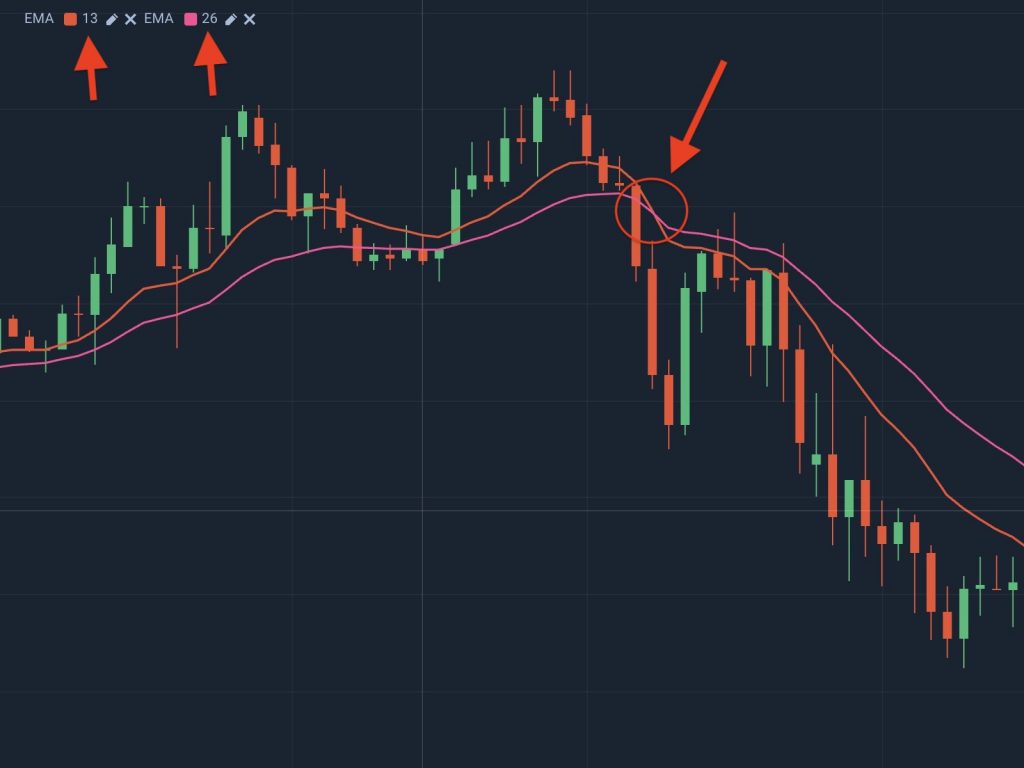
Use two short and long EMAs
You can use EMA-13 and EMA-26 in combination in the short-term. Similar to the use of the 3 EMAs above, the signal of increase or decrease is also when the two EMAs cross.
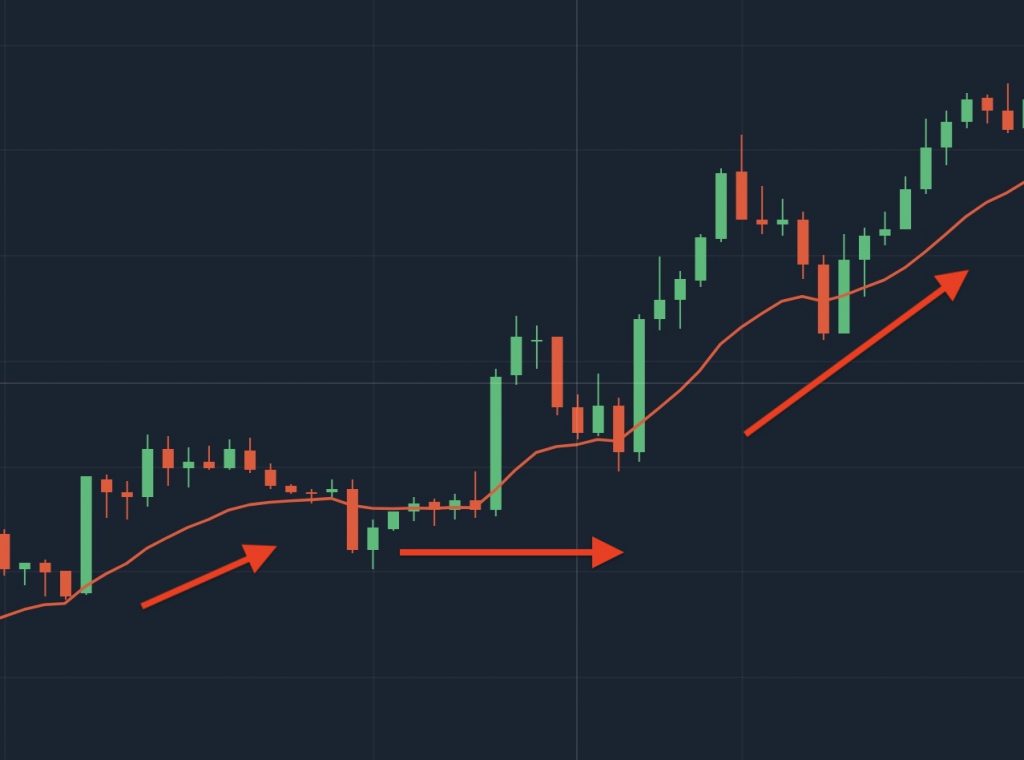
Follow the EMA trend
The nature of the EMA is the same as the SMA, showing uptrend or stability at the moment. Therefore, if you only use a simple EMA indicator, you should buy/sell/enter orders when the EMA has formed an ascending or descending slope.
Other indicator combinations
Do not forget that you should not rely on a single analytical tool. Combining multiple tools together greatly increases the accuracy of the prediction.
![]() English
English ![]() हिन्दी
हिन्दी ![]() Indonesia
Indonesia ![]() Tiếng Việt
Tiếng Việt ![]() العربية
العربية


")
 General Risk Notification: Transactions offered by Olymp Trade can be executed only by fully competent adults. Transactions with financial instruments offered on Olymp Trade involve substantial risk and trading may be very risky. If you make Transactions with the financial instruments offered on Olymp Trade, you might incur substantial losses or even lose everything in your Account. Before you decide to start Transactions with the financial instruments offered on Olymp Trade, you must review the Service Agreement and Risk Disclosure Information. Olymp Trade is operated by Saledo Global LLC; Registration number: 227 LLC 2019; Registered Office Address: First Floor, First St. Vincent Bank Ltd Building, P. O Box 1574, James Street, Kingstown, St. Vincent & the Grenadines.