
![]() English
English ![]() हिन्दी
हिन्दी ![]() Indonesia
Indonesia ![]() Tiếng Việt
Tiếng Việt ![]() العربية
العربية
Introducing the Fibonacci indicator
The Fibonacci indicator is widely used in technical analysis derived from the mathematical theory of Leonardo Bonacci living in the 12th century. He is also known as Fibonacci and many other names.
Register Olymp Trade & Get Free $10,000 Get $10,000 free for newbies
According to his theory, Fibonacci is a series of numbers starting from 0 and 1, each next number equal with the sum of the two numbers before it. For example: 0, 1, 2, 3, 5, 8, 13, 21, 34, 55, 89, 144, 233, 377, 610, 987 …
From those numbers above, people analyzed it by dividing each other in random ways and got some repeat ratios more than normal. These are the ratios: 1,618% (the golden ratio), 23.6%, 38.2%, 61.8%. Incidentally, these ratios are very common in nature.
Fibonacci shapes
There are 2 most popular types of Fibonacci:
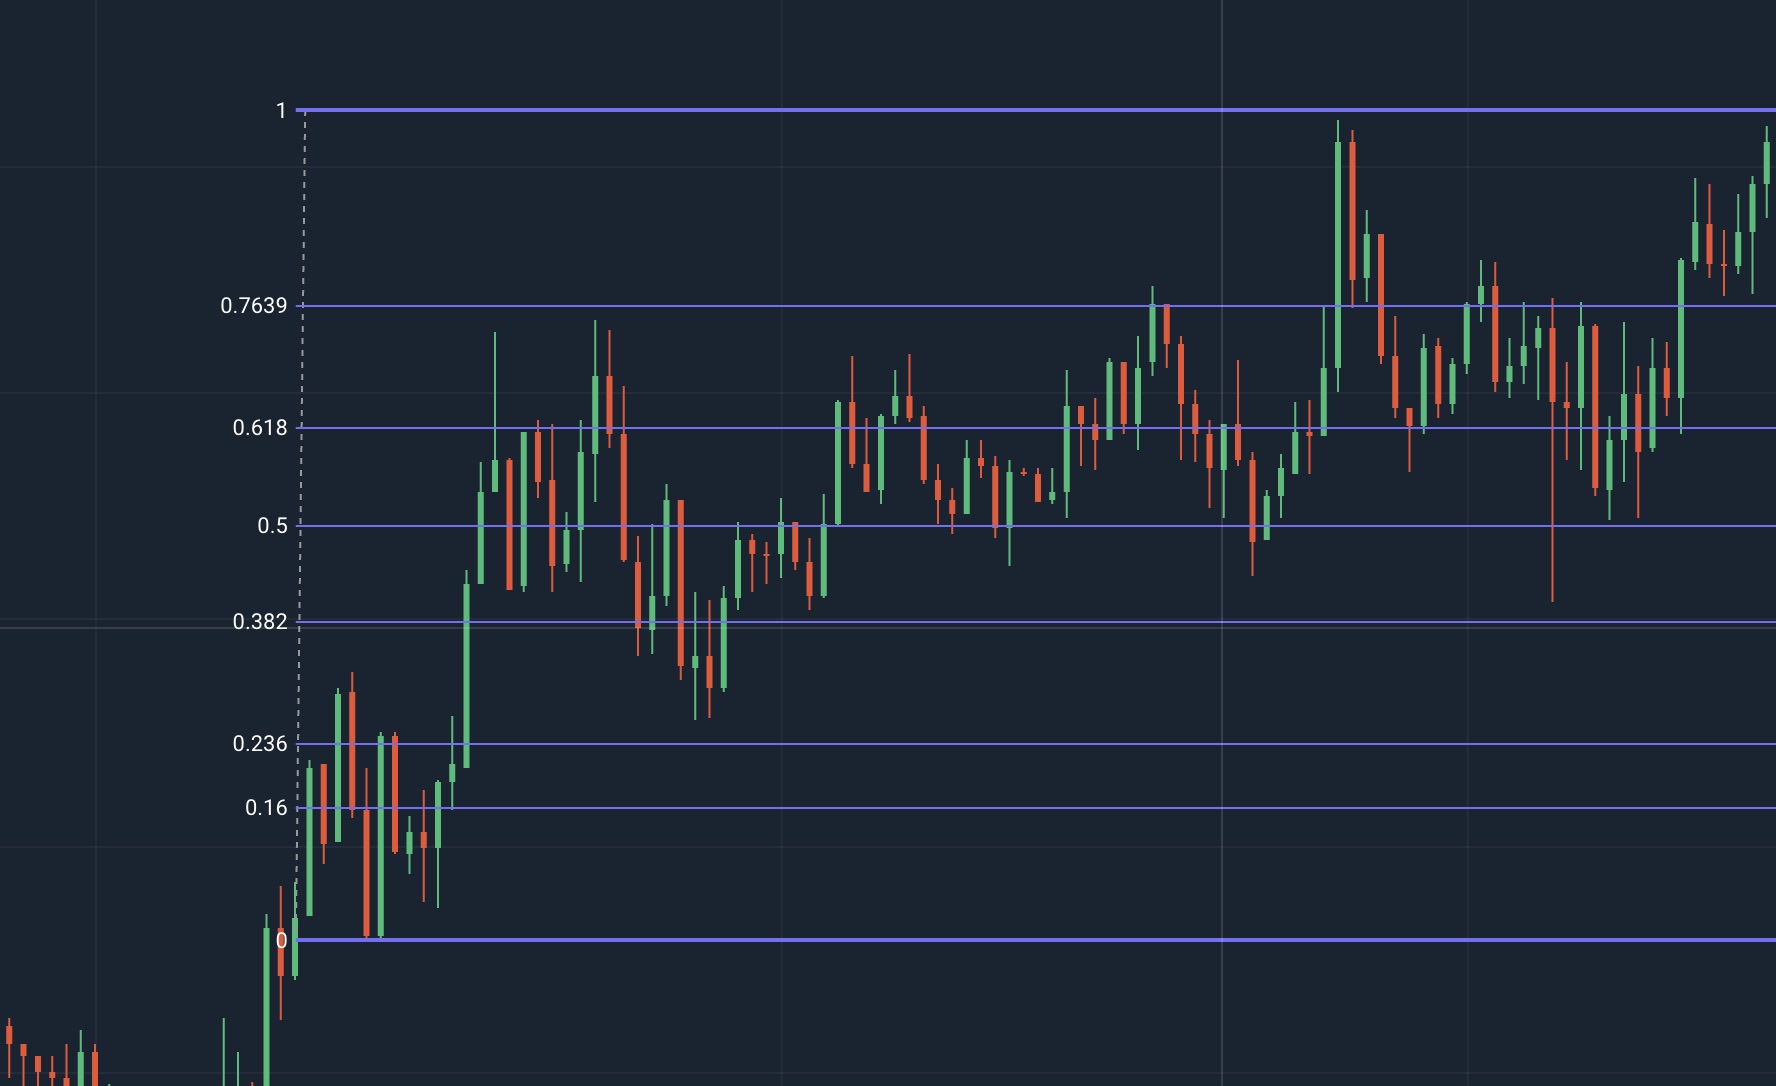
Fibonacci retracement
A horizontal range of thresholds representing the resistance and support level with the golden ratio. You can set up min and max in any position. Then, work with supports, resistances created by Fibonacci indicator as work with normal support, resistance.
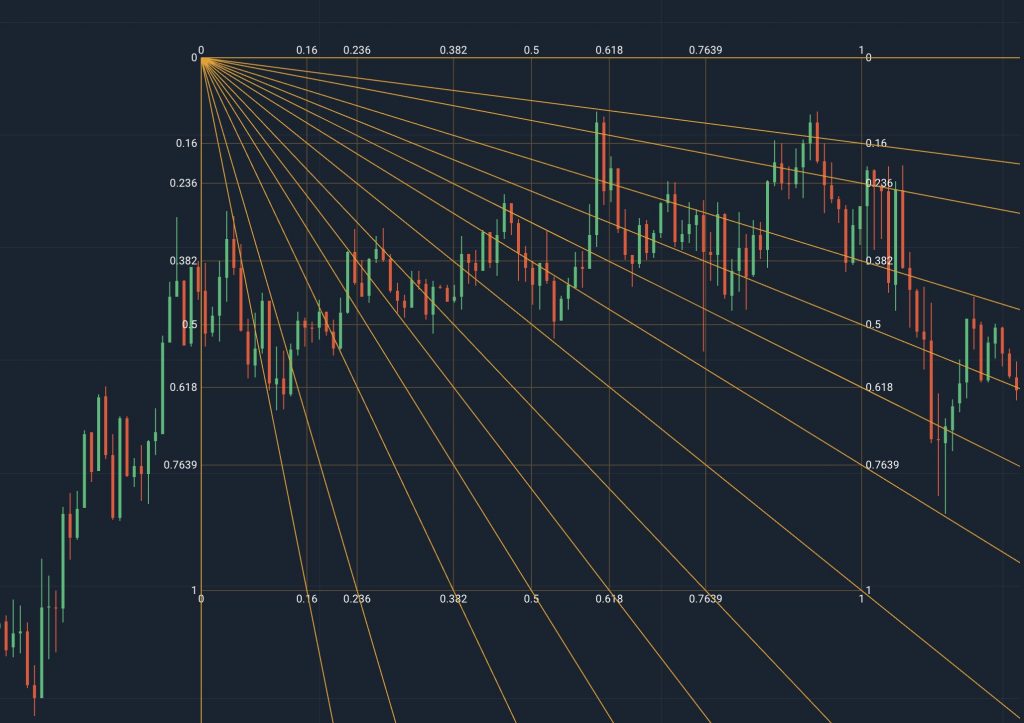
Fibonacci Fan
This indicator contains diagonal lines, you can set it following the direction of the graph to shape the Fibonacci graph in the desired direction. The alignment can help you see clearly the support and resistance levels along the slope. Now just need to catch the signal according to these cross thresholds.
Register Olymp Trade & Get Free $10,000 Get $10,000 free for newbies
There are also Fibonacci extensions, Fibonacci time zones, Fibonacci golden spiral.
Each level from 0 to 1 has different specifications. A trader needs to determine whether these benchmarks are Critical or Support points. The analysis of historical data confirms this relative division.
|
1 (or 100%) |
Support Level |
|
0.7639 (or 76.39%) |
Support level |
|
0.618 (or 61.8%) |
Support level |
|
0.5 (or 50%) |
Critical level |
|
0.382 (or 38.2%) |
Critical level |
|
0.236 (or 23.6%) |
Critical level |
|
0.16 (or 16%) |
Support level |
|
0 (0%) |
The start point of the calculation |
The effect of the Fibonacci indicator
Fibonacci retracement is most commonly used. Because of their simplicity in helping identify support, resistance, stop-loss, and take-profit points.
Even so, there is no guarantee that prices will react as expected, so people often combine Fibonacci with other indicators. Other negative comments of Fibonacci are that there are too many resistance lines. Prices often fluctuate between these lines, these things are confusing traders in their calculations when calculating the effective threshold.
How to use the Fibonacci indicator
With Fibonacci, you can calculate the threshold where the reversion happens. You just need to select any range and apply the Fibonacci indicator. Capturing the trend of prices quite well through the reversal signals.
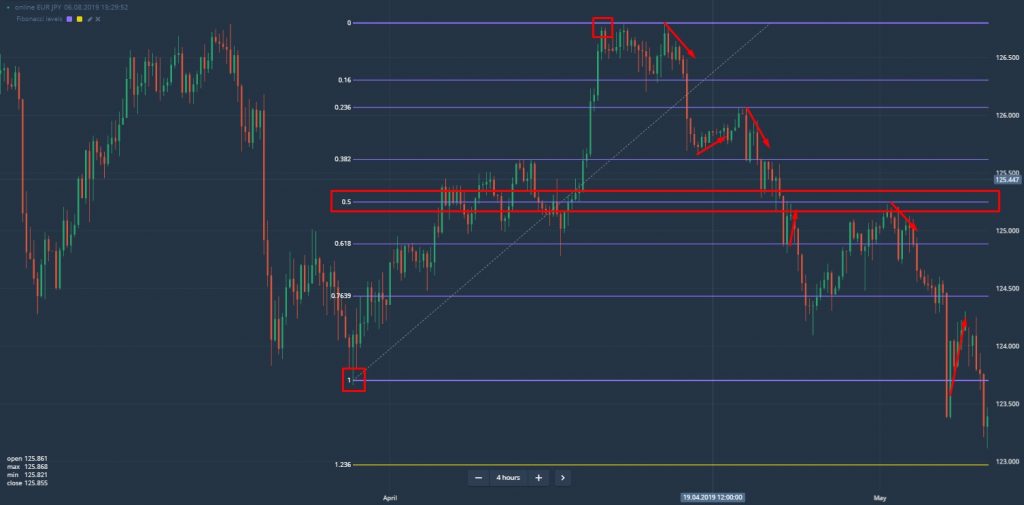
Fibonacci retracement signal
You range the two bottom and top points to create important thresholds 0.1618, 0.236, 0.382, 0.618, 1. In any situation, the thresholds of graph match with at least 3 reversal signals in the past. In the future, the positions at important thresholds will reverse as shown in the picture.
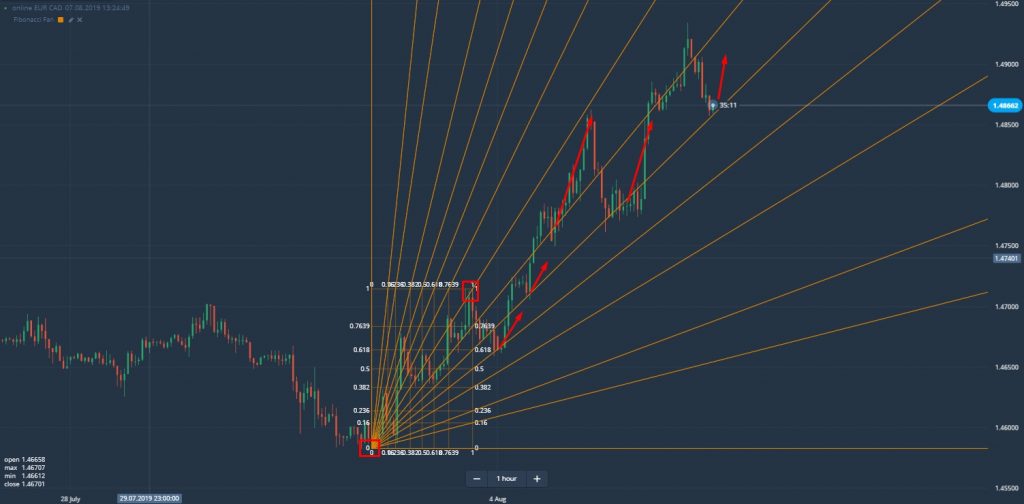
Fibonacci fan indicator
The same is true for the Fibonacci Fan indicator. You should set up to follow the line you see a strong bullish slope occurring about three times.
Fibonacci Fan has more differences. You can adjust the direction of the price zone. Selecting areas to choose resistance, support in a specific direction. Every time the price reaches the resistance levels, gold supports such as 0.1618, 0.618, and 0.238 is a good signal for a reversal.
![]() English
English ![]() हिन्दी
हिन्दी ![]() Indonesia
Indonesia ![]() Tiếng Việt
Tiếng Việt ![]() العربية
العربية


")
 General Risk Notification: Transactions offered by Olymp Trade can be executed only by fully competent adults. Transactions with financial instruments offered on Olymp Trade involve substantial risk and trading may be very risky. If you make Transactions with the financial instruments offered on Olymp Trade, you might incur substantial losses or even lose everything in your Account. Before you decide to start Transactions with the financial instruments offered on Olymp Trade, you must review the Service Agreement and Risk Disclosure Information. Olymp Trade is operated by Saledo Global LLC; Registration number: 227 LLC 2019; Registered Office Address: First Floor, First St. Vincent Bank Ltd Building, P. O Box 1574, James Street, Kingstown, St. Vincent & the Grenadines.