
![]() English
English ![]() हिन्दी
हिन्दी ![]() Indonesia
Indonesia ![]() Tiếng Việt
Tiếng Việt ![]() العربية
العربية
Triangle Chart Pattern is an easy pattern to spot on charts. It is a type of Continue Patterns, but its reliability is weaker than other patterns such as the Rectangle Chart Pattern, the Pennant Chart Pattern.
Using it to increase the probability of opening long orders when using other indicators. This article will guide how to use Triangle Chart Pattern with the easiest to understand.
Register Olymp Trade & Get Free $10,000 Get $10,000 free for newbies
Triangle Chart Pattern
As a type of the Continuation Pattern, you can optionally choose short or long positions. However, Traderrr.com recommends trading long positions, at least as long as the next 6 candles.
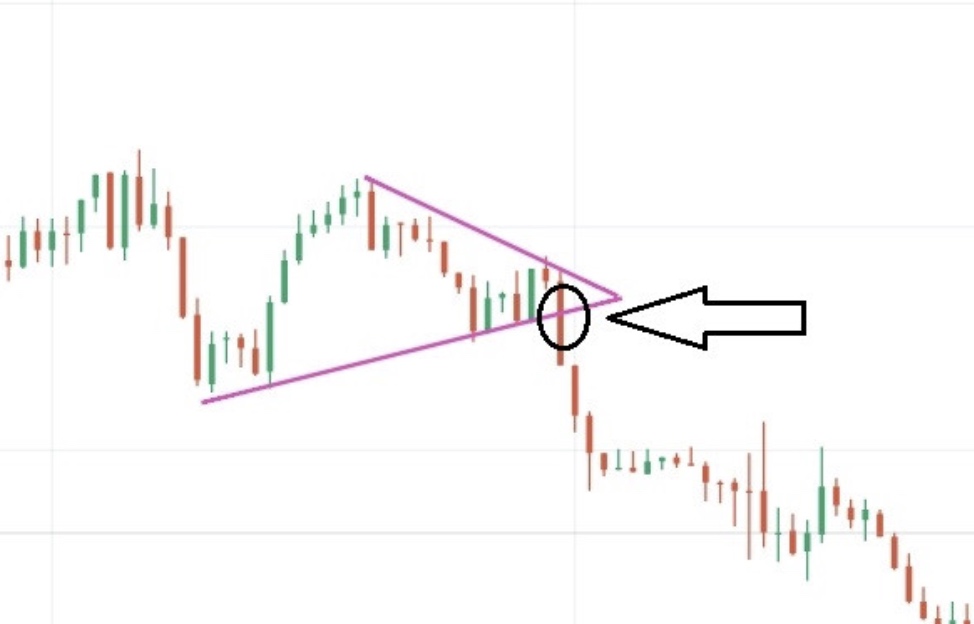
Symmetrical Triangle
A symmetrical triangle pattern is the shape of two Trendlines connecting peaks and bottoms. The intersection point of both should be in the middle vertical. It would be best if you waited till the candlestick crosses the Trendline near the triangle’s vertex. If the candlestick goes above the threshold, you open a bullish order, and if the candle goes down, you open a bearish order.
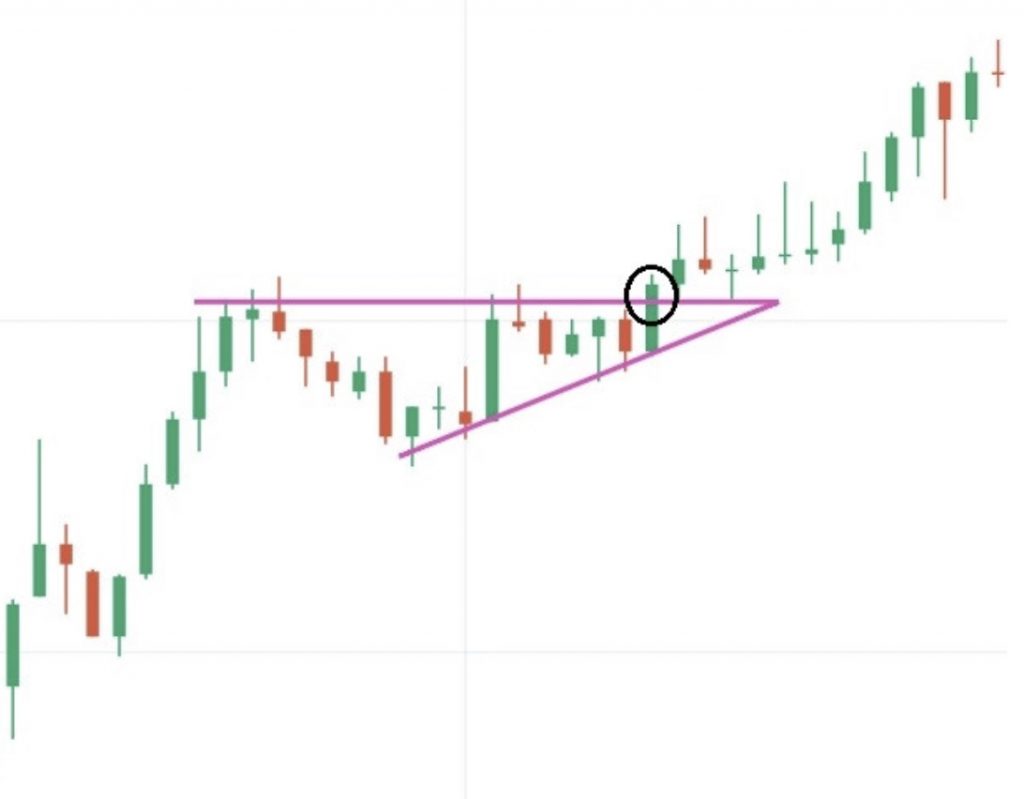
Ascending Triangle
An ascending triangle pattern is a formation where resistance acts as the upper edge. The trendline of the troughs will cut the resistance line to form a triangle. This pattern shows that the price is in an uptrend. But the sign was fragile. You can only enter bullish orders when the price goes above resistance.
Register Olymp Trade & Get Free $10,000 Get $10,000 free for newbies
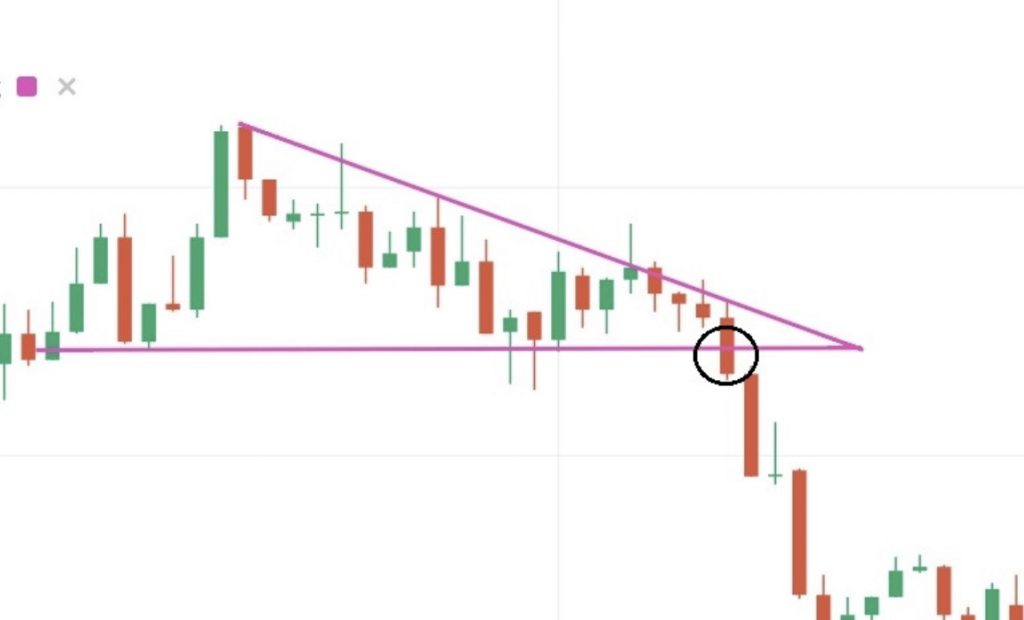
Descending Triangle
In contrast to the ascending pattern, the Descending Triangle shows a descending trend. The Trendline connects the intersecting peaks with the support threshold to create a triangle. At the end of that triangle, the price is likely to surpass the support and move down strongly.
Summary
With all the triangles you take, you need to follow the trend where the price is out of the triangle. Hit up when cross above the resistance, hit down when it breaks the support. And you have a 70% winning by data analysis.
This strategy requires opening a position after at least 6 candles. Have to open trades immediately at the time the price crosses the trendline at the triangle corner.
You can completely combine with other indicators such as MACD, RSI,…
https://traderrr.com/combining-macd-ema-and-parabolic-sar-trading-strategy/
https://traderrr.com/sma-with-support-and-resistance-indicator-fixed-time-trade-strategy/
![]() English
English ![]() हिन्दी
हिन्दी ![]() Indonesia
Indonesia ![]() Tiếng Việt
Tiếng Việt ![]() العربية
العربية

")
")


")
 General Risk Notification: Transactions offered by Olymp Trade can be executed only by fully competent adults. Transactions with financial instruments offered on Olymp Trade involve substantial risk and trading may be very risky. If you make Transactions with the financial instruments offered on Olymp Trade, you might incur substantial losses or even lose everything in your Account. Before you decide to start Transactions with the financial instruments offered on Olymp Trade, you must review the Service Agreement and Risk Disclosure Information. Olymp Trade is operated by Saledo Global LLC; Registration number: 227 LLC 2019; Registered Office Address: First Floor, First St. Vincent Bank Ltd Building, P. O Box 1574, James Street, Kingstown, St. Vincent & the Grenadines.