
![]() English
English ![]() हिन्दी
हिन्दी ![]() Indonesia
Indonesia ![]() Tiếng Việt
Tiếng Việt ![]() العربية
العربية
Simple Moving Average (SMA) indicator
You combine the SMA and the Support and Resistance indicators to open long positions. This strategy does not care for small fluctuations.
Ignoring small fluctuations helps you avoid unexpected failure, partly because the order period is too short. So any small spread is reasonable. Because there are uncontrollable unintentional effects. The best way to avoid such confusing losses is to open long positions.
Within a minute the price can move a lot but with a position of 30 minutes or more, there will be no spreads close to the position you opened. Traderrr.com will guide you to combine two reliable indicators, the SMA and the Support and Resistance indicator, to open long positions.
Register Olymp Trade & Get Free $10,000 Get $10,000 free for newbies
How to use SMA combine Support Resistance
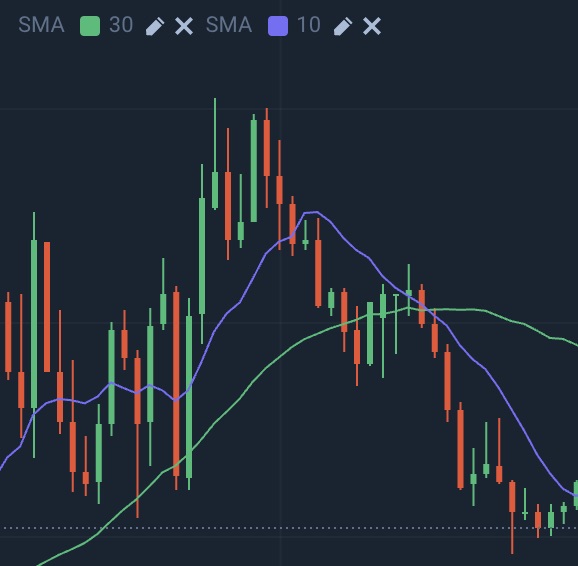
Use SMA 10 and SMA 30
SMA is the Simple Moving Average, the simplest made up of the average of the closest candles. It can also be said that the SMA is the trend line of the market depending on how you set param on it.
SMA combines Support and Resistance suitable for long positions with short candle session times.
To analyze this strategy, you need to use SMA-10 and SMA-30 beside the Support and Resistance thresholds. The Support and Resistance thresholds are up to you. https://traderrr.com/support-and-resistance-how-to-find-and-how-to-use-it/
Signal
When the SMA-10 crossed the SMA-30 and started to expand (Divergence), the price now is following the trend of SMA-10. If the SMA-10 goes up, the market goes up, the SMA-10 goes down, the market falls.
If SMA 10 and SMA continuously cross, the gap does not widen but tends to move closer to each other, this signal shows the market is balanced at this time.
Register Olymp Trade & Get Free $10,000 Get $10,000 free for newbies
You open a position once the price breaks through Support/Resistance and the two SMA divergence to one side.
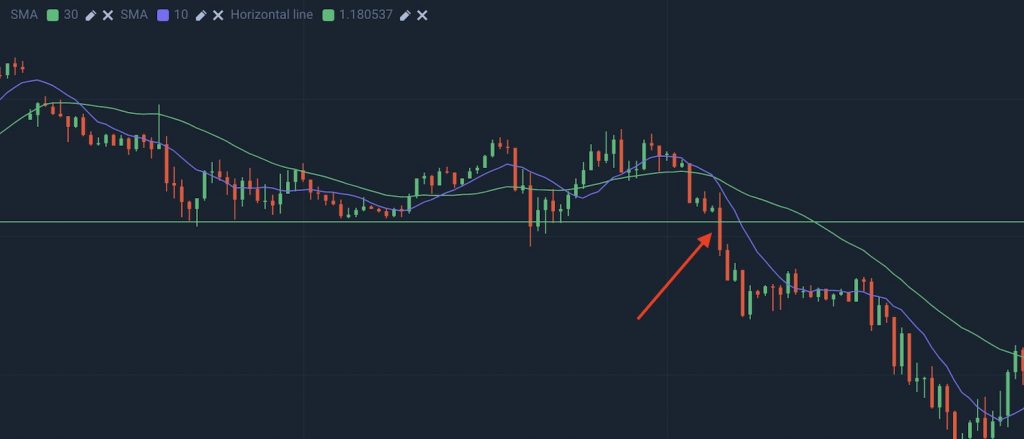
If the 10 SMA is down, you should enter a bearish position. And vice versa, if the 10 SMA is pointing up, you should enter a bullish position.
Opening a trade longer than 30 minutes with a session time of 5 minutes is the best for this circumstance. By this ratio, you can trade with 10 minutes sessions with time from 60 minutes and more.
Conclude
This entry strategy is really simple, is it easy to recognize the cut-off point and the divergence of the two SMA lines. What you need to do now is wait for the 10 SMA to cut the Support and Resistance and make a trade.
You have to enter long positions because of the combination of the 10 SMA and the 30 SMA. The 30 SMA shows the trend over the long term, while the 10 SMA shows short-term abnormal changes. So, when there is a difference happening at SMA 10, it proves that the price is fluctuating. These fluctuations affect the trend in the long term, which is confirmed by the price surpassing the Support / Resistance level.
Therefore, when analyzing the indicator that shows the above signals, you should make a trade immediately.
![]() English
English ![]() हिन्दी
हिन्दी ![]() Indonesia
Indonesia ![]() Tiếng Việt
Tiếng Việt ![]() العربية
العربية


")


")
 General Risk Notification: Transactions offered by Olymp Trade can be executed only by fully competent adults. Transactions with financial instruments offered on Olymp Trade involve substantial risk and trading may be very risky. If you make Transactions with the financial instruments offered on Olymp Trade, you might incur substantial losses or even lose everything in your Account. Before you decide to start Transactions with the financial instruments offered on Olymp Trade, you must review the Service Agreement and Risk Disclosure Information. Olymp Trade is operated by Saledo Global LLC; Registration number: 227 LLC 2019; Registered Office Address: First Floor, First St. Vincent Bank Ltd Building, P. O Box 1574, James Street, Kingstown, St. Vincent & the Grenadines.