
![]() English
English ![]() हिन्दी
हिन्दी ![]() Indonesia
Indonesia ![]() Tiếng Việt
Tiếng Việt ![]() العربية
العربية
Rectangle Chart Pattern
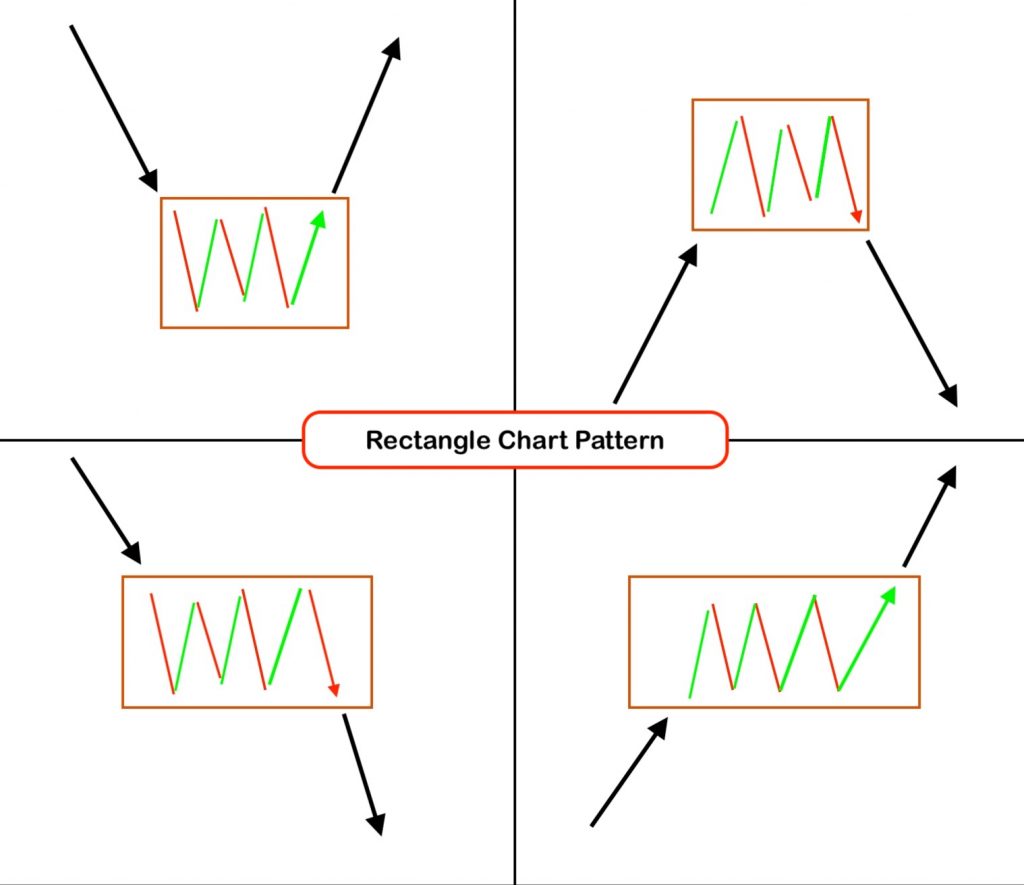
A Rectangle or Box is a continuation pattern that indicates a chart price where sell and buy seem fairly balanced in a period of time. The asset price moves in a tight range, seeking support at the rectangle’s bottom and hitting the resistance at the rectangle’s top.
Rectangle or Box pattern helps you open long trades. They are built on the Support and Resistance indicator.
The Signals
The Rectangle Pattern is a very recognizable one. When the price is moving stable inside support and resistance lines, which are made up of two or more peaks/lows, it is also known as a strong support and resistance line.
Register Olymp Trade & Get Free $10,000 Get $10,000 free for newbies
The price chart will be like walking in a box, constantly touching the top edge and bottom edge, and bouncing back. The characteristic feature of these patterns is that they usually appear at the end of an uptrend or a downtrend. For example, during a downtrend, prices begin to slow down, forming this pattern, then the price trend is upward. This is similar to the uptrend.
Open the trade use Rectangle Chart Pattern
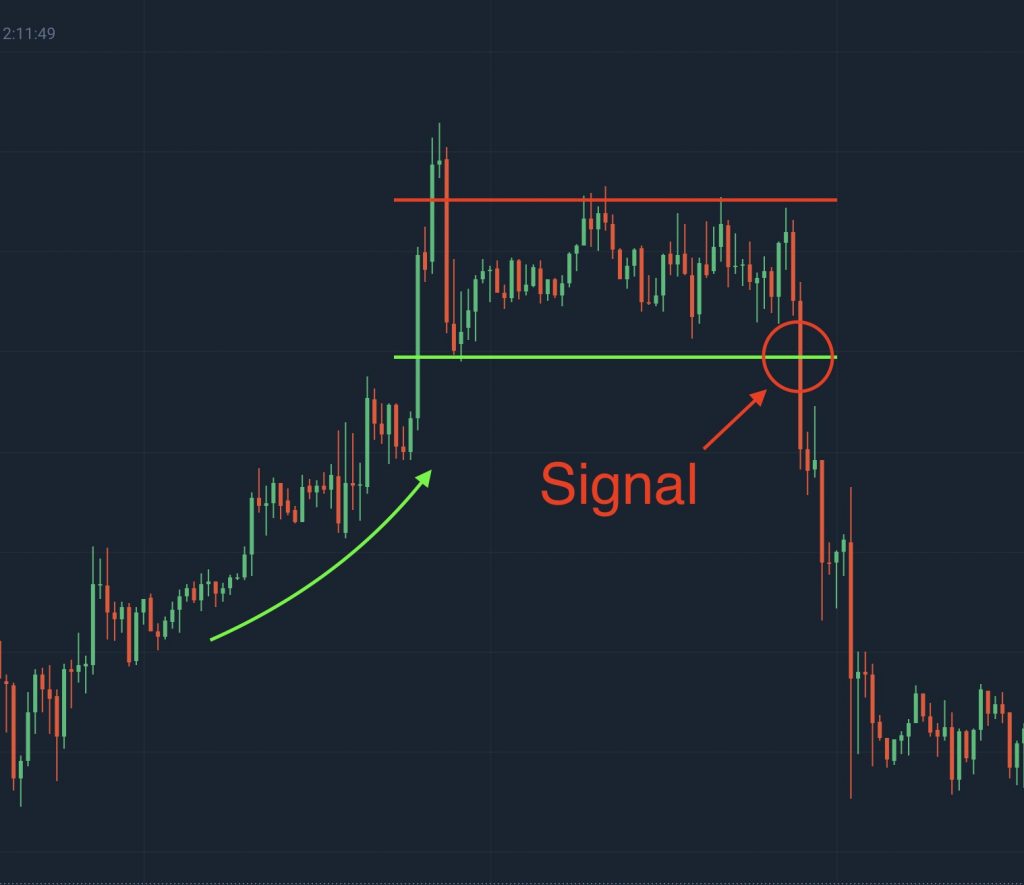
Open a short position
When the price goes in the Support and Resistance zone, you can open short-term trades. Because when going in this zone, the price will keep bouncing until the accumulation is strong enough to reverse. So, you should use the Support and Resistance indicator to trade.
https://traderrr.com/support-and-resistance-how-to-find-and-how-to-use-it/
Open a long position when the price crosses the threshold
To find out when the price is over the threshold, you can check out the following article: https://traderrr.com/breakout-support-and-resistance-entry-position-on-fixed-time-trade/
The two support and resistance lines forming a Rectangle Chart Pattern are very strong barriers. So when the price is about to break the barrier, it needs a very strong force, which creates some long candles. It is also time to make a trade follow the trend.
You should also practice identifying false barrier crossings, where the price will revert back into the rectangle. This is a fairly safe way to play Fixed Time Trade on Olymp Trade
Maybe you need:
https://traderrr.com/sma-with-support-and-resistance-indicator-fixed-time-trade-strategy/
https://traderrr.com/trendline-combines-support-and-resistance-for-the-fixed-time-trade/
https://traderrr.com/pinbar-candlesticks-with-support-and-resistance-trading-strategy/
![]() English
English ![]() हिन्दी
हिन्दी ![]() Indonesia
Indonesia ![]() Tiếng Việt
Tiếng Việt ![]() العربية
العربية


")


")
 General Risk Notification: Transactions offered by Olymp Trade can be executed only by fully competent adults. Transactions with financial instruments offered on Olymp Trade involve substantial risk and trading may be very risky. If you make Transactions with the financial instruments offered on Olymp Trade, you might incur substantial losses or even lose everything in your Account. Before you decide to start Transactions with the financial instruments offered on Olymp Trade, you must review the Service Agreement and Risk Disclosure Information. Olymp Trade is operated by Saledo Global LLC; Registration number: 227 LLC 2019; Registered Office Address: First Floor, First St. Vincent Bank Ltd Building, P. O Box 1574, James Street, Kingstown, St. Vincent & the Grenadines.