
![]() English
English ![]() हिन्दी
हिन्दी ![]() Indonesia
Indonesia ![]() Tiếng Việt
Tiếng Việt ![]() العربية
العربية
The combination of MACD – EMA – Parabolic PSAR is very popular to find reversal points. This tactic gives a very high probability of accuracy on orders longer than 30 minutes.
The strategy on long-term
People said long orders have a higher chance of winning than short orders. Even so, it doesn’t mean that long orders will always yield higher returns.
It is said that long positions have a higher probability of winning than short orders. Even so, I am not saying that long positions will always yield higher returns than short positions. That is why you need to master basic strategies.
This article will guide you on how to use the trading combination strategy of MACD – EMA – Parabolic PSAR through the interface of Olymp Trade broker which has provided tools.
Register Olymp Trade & Get Free $10,000 Get $10,000 free for newbies
How to do Long-term trading with MACD, EMA and Parabolic SAR strategy
Setting up on Olymp Trade
At the Olymp Trade trading interface, you need to set up those indicators. Note that it is best to use the candlestick indicator and the duration is 5 minutes per candle.
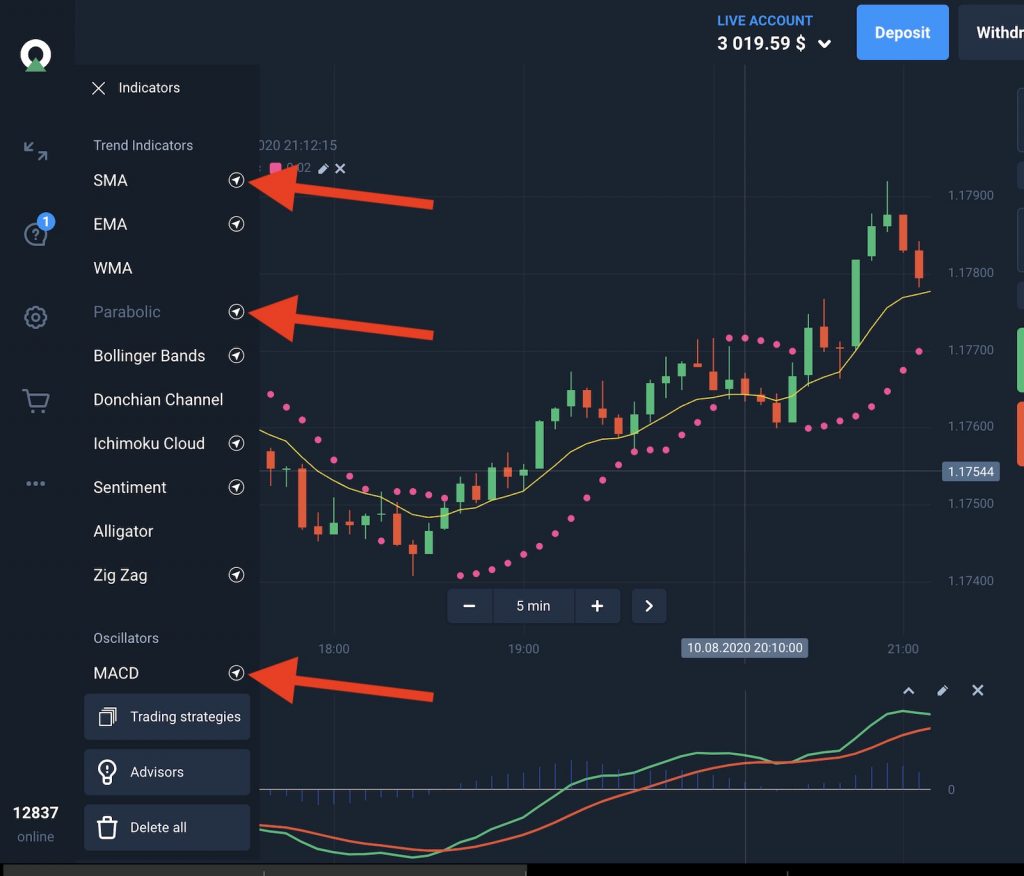
Default settings of indicators are:
- Parabolic: 0.02
- EMA: 10
- MACD: 12, 26, 9
Signals
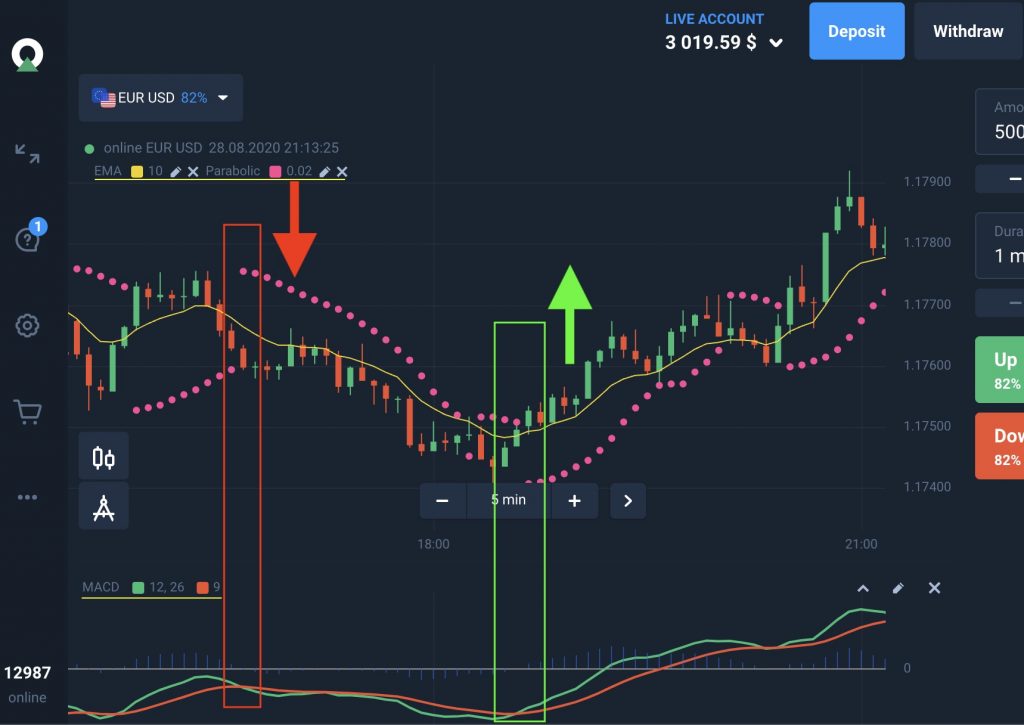
Signal to place Up / Buy orders
When the price is in a downtrend, it will be about to increase again if there are the following signals:
- The green MACD 12, 26 cuts the red MACD 9 from the bottom and continues to go up.
- The yellow EMA10 indicator moves up after the new green candle. But the EMA10 should always be below the candlestick chart.
- The Parabolic SAR indicator line has been above the candlestick chart until now, starting to move below the candlestick chart.
Signal to place Down / Sell positions
When the uptrend is about to end to initiate the downtrend, these signals will appear:
- The green MACD 12.26 line cuts the red MACD 9 line from above and continues to move downwards.
- The yellow EMA10 moves below the new red candle then starts to move above the candlestick chart.
- The PSAR indicator line appeared below the last candle of the trend and started to appear above.
Conclusion
The combination of these three indicators produces relatively accurate entry times for long orders. The MACD, EMA, and PSAR indicator at the same time all showed signs of a reversal time. That is why you should enter commands that receive the above signals.
This strategy is a combination of all 3 indicators and it only works when there are signals of all 3 indicators at the same time. So wait for the right time and place orders, patience is the most important factor in using indicators and tactics.
Indeed, this indicator is only effective for long orders, especially 5-minute candles with 30 minutes long order is always the best choice for traders. However, you need to experience everything by yourself. So feel their effectiveness from the demo account before playing for real. After realizing the possibilities of this strategy, let’s trade large sums of money.
If you have any questions about MACD, EMA, or PSAR indicators, feel free to leave a comment below.
![]() English
English ![]() हिन्दी
हिन्दी ![]() Indonesia
Indonesia ![]() Tiếng Việt
Tiếng Việt ![]() العربية
العربية


")


")
 General Risk Notification: Transactions offered by Olymp Trade can be executed only by fully competent adults. Transactions with financial instruments offered on Olymp Trade involve substantial risk and trading may be very risky. If you make Transactions with the financial instruments offered on Olymp Trade, you might incur substantial losses or even lose everything in your Account. Before you decide to start Transactions with the financial instruments offered on Olymp Trade, you must review the Service Agreement and Risk Disclosure Information. Olymp Trade is operated by Saledo Global LLC; Registration number: 227 LLC 2019; Registered Office Address: First Floor, First St. Vincent Bank Ltd Building, P. O Box 1574, James Street, Kingstown, St. Vincent & the Grenadines.