
![]() English
English ![]() हिन्दी
हिन्दी ![]() Indonesia
Indonesia ![]() Tiếng Việt
Tiếng Việt ![]() العربية
العربية
Support and Resistance Indicator is an essential tool for most traders who are trading Fixed Time Trade. But sometimes you wonder why you cannot predict when the price will cross the threshold? At some point, the price will cross the threshold a bit and then return, sometimes it overcomes. Traderrr.com will guide you to recognize when the price is over the threshold then continue the trend.
How to recognize the overcome
If you do not know the Support and Resistance indicator, you can check out the following article: https://traderrr.com/support-and-resistance-how-to-find-and-how-to-use-it/
Let’s get into the main point, why did the price cross the threshold? While the price chart moves, creating a lot of Support/Resistance, just a few of them are considered a reasonable threshold of reversal. And most of them have a negligible threshold. The negligible threshold cannot keep the price inside the zone, this is why a breakout appears.
Register Olymp Trade & Get Free $10,000 Get $10,000 free for newbies
Strong thresholds
A threshold created from more than 2 peaks or 2 lows is called a strong threshold. The price will have a high probability of reversing upon touching these levels. In order for the price to break out of the zone, it is necessary to have some long candlestick with stronger signals than normal. They may be influenced by news accumulation (the asset that increases over multiple transactions).
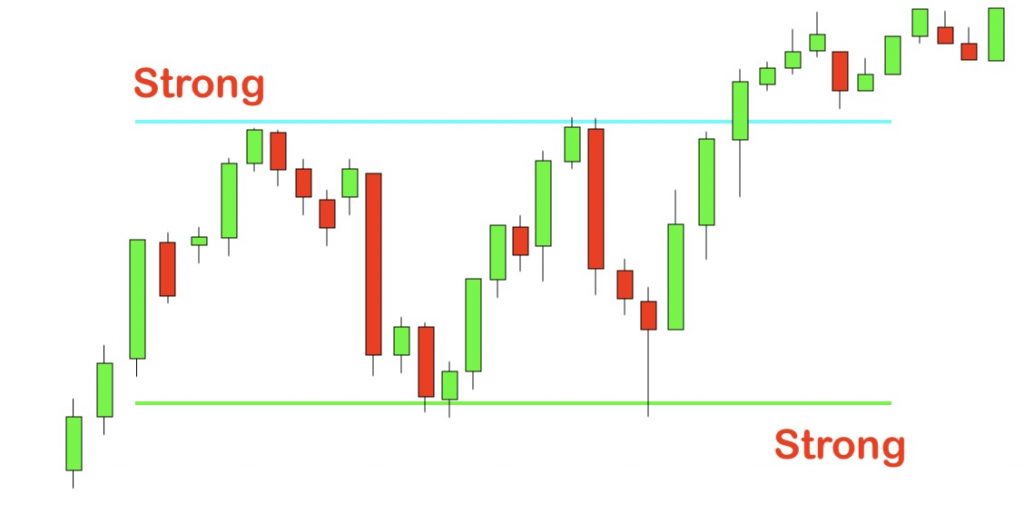
The easiest way is to look for recent candles to see if they are long candles or not. The accumulation line can also be a sideways line, it can also be a slight oscillator. Then breakout with big candles, creating strong volatility.
As for the weak thresholds, it has a high rate exceeding the threshold so you should open an order to increase.
Fake breakout
You absolutely have many times entering orders to exceed resistance but ultimately reversal points.
To avoid losing money, you need to identify the trend of the price. If the price is moving in a downtrend but the accumulation is moving sideways above the strong support line, it is not possible to immediately reverse to bullish.
In addition, it will not be reliable enough if only 1 candlestick surpasses the Support/Resistance. It needs more than a breakout candlestick. It almost returns quickly if it fails to qualify. You can easily see by indicators Parabolic Sar, MACD,… When other indicators indicate that the price will reverse, you shouldn’t make a trade up.
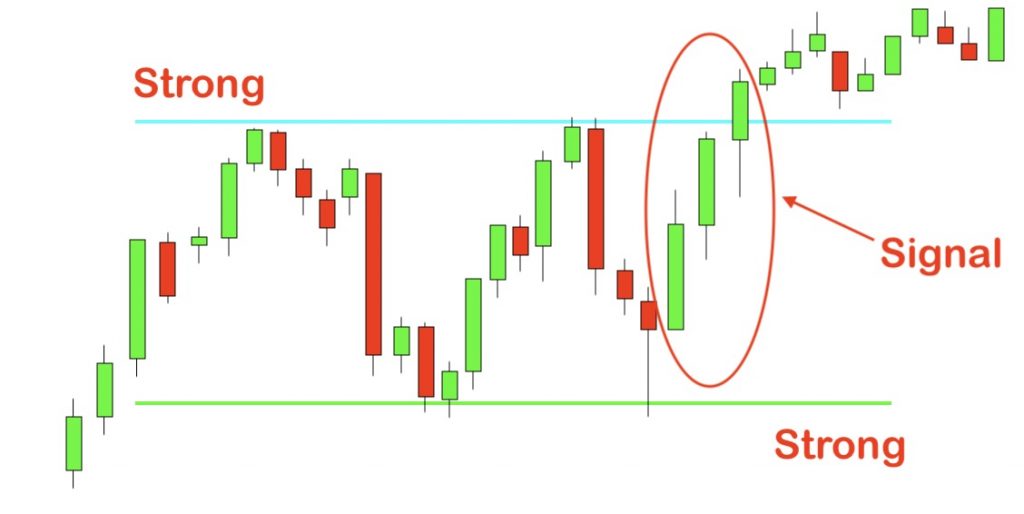
Catch a Support/Resistance Break-out
When the price has just surpassed the strong support and resistance, you must open a position that continues the direction of the price, not reverse.
Register Olymp Trade & Get Free $10,000 Get $10,000 free for newbies
A lot of traders see the price drop and judge it as the price already bottomed or peaked, and should reverse it. But in fact, when the price has surpassed the strong resistance/support, the price will tend to continue developing instead of reversing.
At this point, it is best to enter a short position for 5 minutes or 10 minutes.
Depending on the corresponding indicators, you can enter a 5-minute order with a 1-minute chart, open a 30-minute order with a 5-minute chart.
Do not open orders when there are multiple thresholds
If there are multiple support and resistance areas appearing, you should not open a position. You should wait for a clearer moment, an independent strong threshold.
Trade with the Bollinger Bands indicator
When the price reaches the Bollinger Bands, you can open trade to follow up on the trend.
![]() English
English ![]() हिन्दी
हिन्दी ![]() Indonesia
Indonesia ![]() Tiếng Việt
Tiếng Việt ![]() العربية
العربية


")


")
 General Risk Notification: Transactions offered by Olymp Trade can be executed only by fully competent adults. Transactions with financial instruments offered on Olymp Trade involve substantial risk and trading may be very risky. If you make Transactions with the financial instruments offered on Olymp Trade, you might incur substantial losses or even lose everything in your Account. Before you decide to start Transactions with the financial instruments offered on Olymp Trade, you must review the Service Agreement and Risk Disclosure Information. Olymp Trade is operated by Saledo Global LLC; Registration number: 227 LLC 2019; Registered Office Address: First Floor, First St. Vincent Bank Ltd Building, P. O Box 1574, James Street, Kingstown, St. Vincent & the Grenadines.