
![]() English
English ![]() हिन्दी
हिन्दी ![]() Indonesia
Indonesia ![]() Tiếng Việt
Tiếng Việt ![]() العربية
العربية
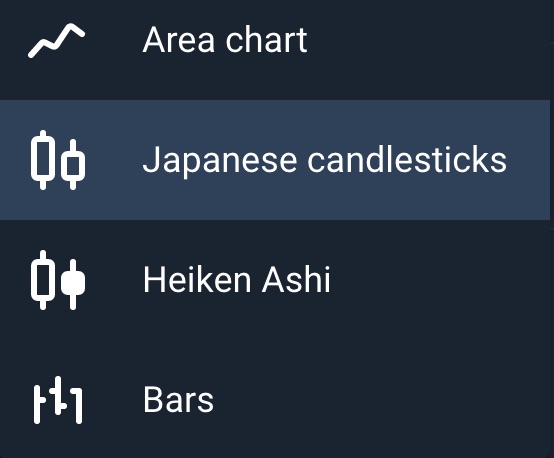
The four basic charts in technical analysis are the Japanese Candlesticks Chart, Heiken Ashi chart, Area chart, and Bar chart. Each chart type gives you a different view of the market. Combining multiple charts at the same time can give you an overview of the market.
Japanese Candlesticks Chart
Overview
The Japanese candlesticks chart is a commonly used chart in technical analysis. A candlestick is a collection of sets including Opening Price, Closing Price, Peak, Bottom. Each part of a candlestick can be used for different indicators to help you achieve efficiency in technical analysis.
Register Olymp Trade & Get Free $10,000 Get $10,000 free for newbies
Features of the Japanese Candlesticks chart
- Opening Price of a candle is created by the price of the end of the previous candle.
- Closing Price is the price at the end of the time of a session.
- The oscillation of candles during the trading session will create a peak and a trough, which always contain the opening and closing price.
- Thus, a session will have 4 points of note: Opening price (starting point), Closing price (ending point), peak price, and bottom price.
- The opening and the closing create a candle, the top and the bottom will create thin columns. Typically, peaks and troughs will be used in indicators more than opening and closing points.
- If the ending point is lower than the starting point, then the candle is red. On the contrary, when the ending point is higher than the starting point, the green candle contest. Red signals a decrease, while green signals an increase after the expiry of the session.
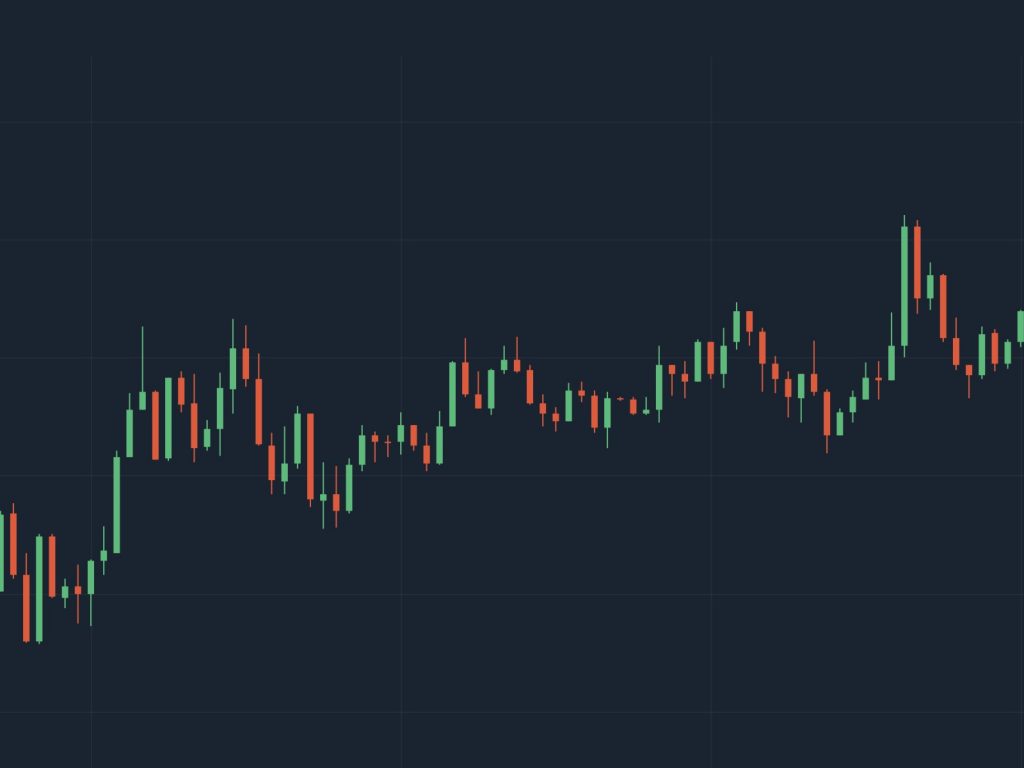
It can be said that the Japanese candlesticks chart shows the relationship between the opening and closing prices, which make up a candle. The advantage of it is that you can easily recognize the tunnel created by the top and bottom, making it easier to see graph waves.
Heiken Ashi candlesticks chart
Overview
The Heiken Ashi chart is also a candlesticks chart, but it is modified to turn into a trend representation chart. That is, instead of using the opening and closing prices, the Heiken Ashi chart has simulated the opening and closing prices based on the average formula. Only the top and bottom prices are retained.
Features of Heiken Ashi Candlesticks chart
- The starting point of the Heiken Ashi candle is calculated by the formula: (Opening price of previous candle + Closing price of previous candle) / 2.
- Heiken Ashi candle end is calculated by the formula: (Current opening price + Current closing price + Peak price + Bottom price) / 4.
- The top and bottom of the Heiken Ashi candle will be equal to the Peak and Bottom of the Japanese candle.
- The starting point and the ending point will create a candle, the top and the bottom will create thin columns like a thread.
- If the ending point is lower than the starting point, then the candle is red. On the contrary, state the ending point is higher than the starting point of the green candle contest. Red signals a decrease, while green signals an increase after the expiry of the session.
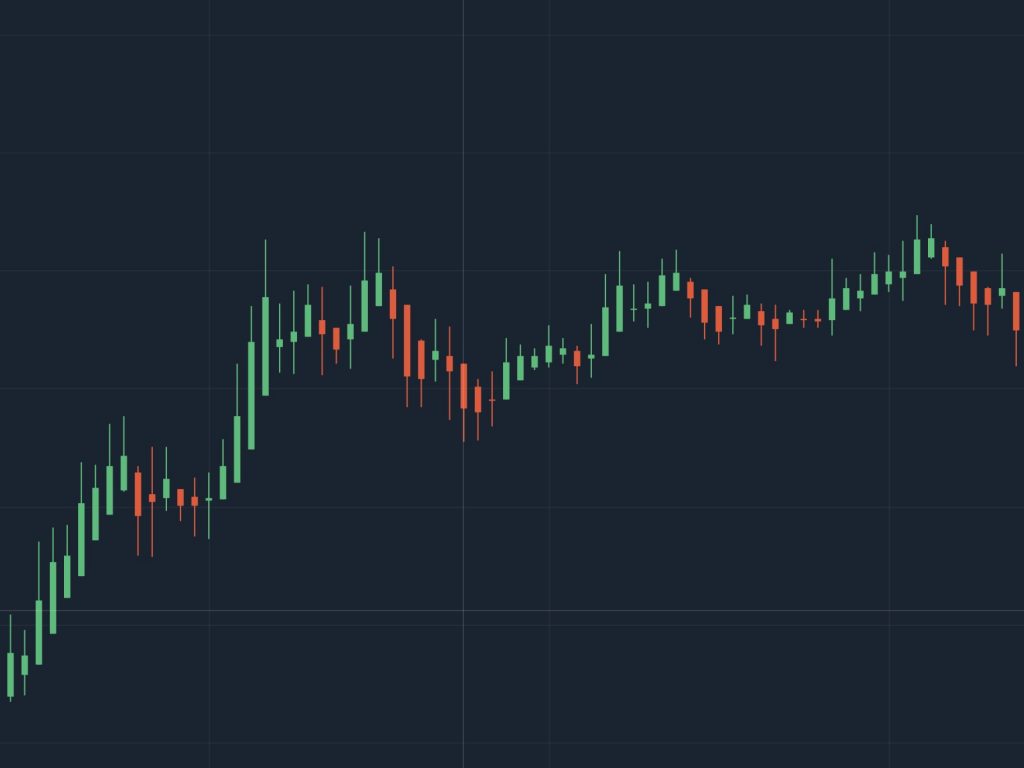
Thus, the Heiken Ashi candle fluctuates relatively slightly because the average is used to ignore small fluctuations. When you look at the chart created by the Heiken Ashi candle, you will get a better look at the price trend.
Area chart
This chart uses a straight line that connects the closing price of every session. Form a connecting line, fluctuating up and down with a clear slope.
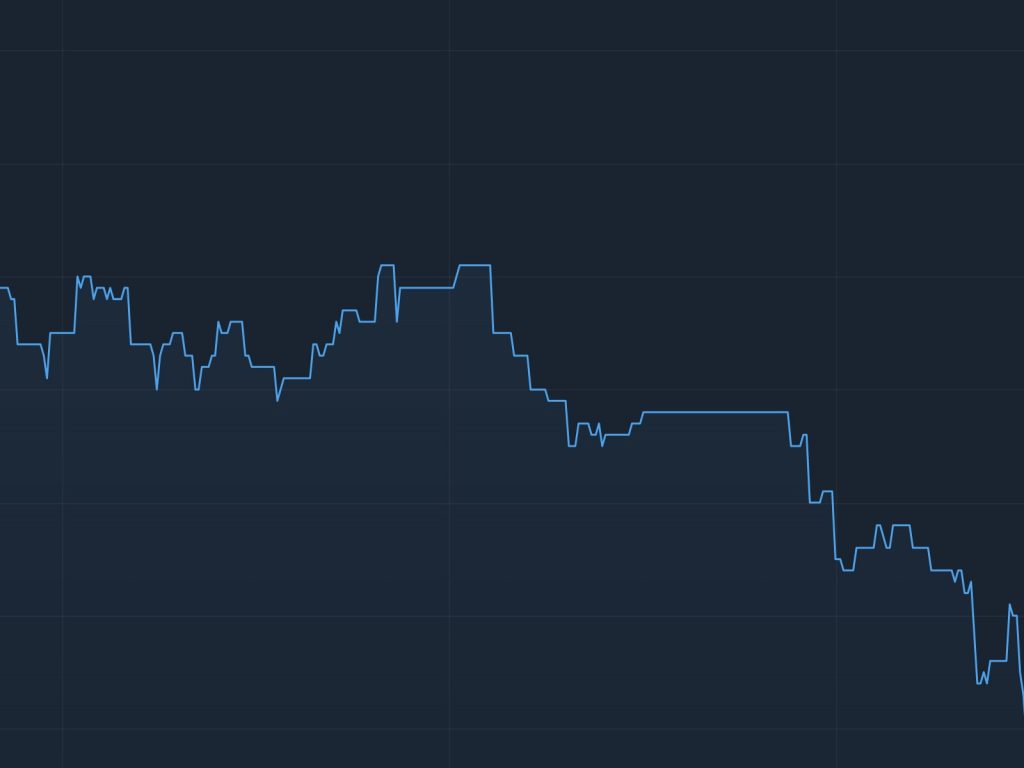
This form is only for those who love simplicity, need not be too complicated. A good example is the use of the Bollinger Bands indicator to pick up signals when prices move sideways. A flat price will create horizontal lines that will cause the Bollinger Bands to shrink, which will generate corresponding resistance and support. Then, just a divergence signal, a breakout of a resistance/support line will make the entry appear.
Register Olymp Trade & Get Free $10,000 Get $10,000 free for newbies
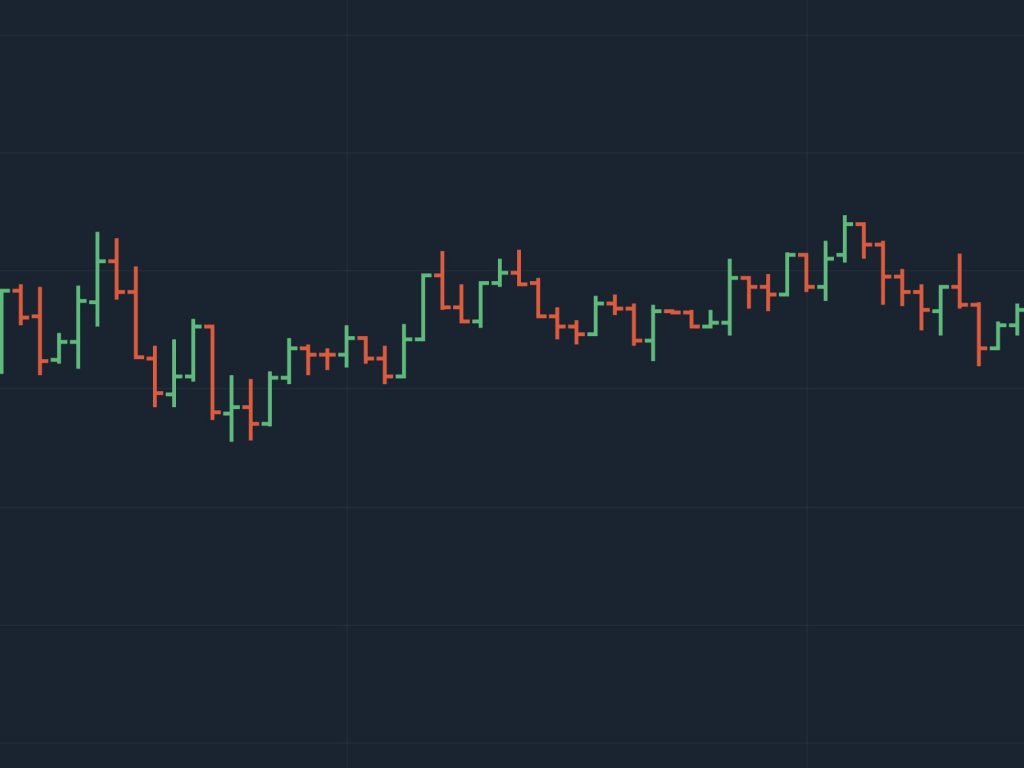
Bar chart
Its properties are identical to the Japanese Candlestick chart which differs in appearance only. The Bar chart is full of closing prices, opening prices, peaks, and bottoms. The only difference is that instead of a candle-like shape, it is shaped like a tube connected together.
Very few users use this chart simply because using the Japanese Candlestick chart is enough.
Conclude
The Japanese Candlestick chart and the Bar chart are essentially the same, and can be used for both short and long term trading.
The Heiken Ashi candlestick chart and the Area chart should be used for long-term transactions.
However, your most important thing is to familiarize yourself with your best comfortable trading way, mastering your strategies and emotions when trading. Choosing charts is only a tool to support your judgment, practicing to improve your trading skills to a high level is the most important method.
![]() English
English ![]() हिन्दी
हिन्दी ![]() Indonesia
Indonesia ![]() Tiếng Việt
Tiếng Việt ![]() العربية
العربية


")
 General Risk Notification: Transactions offered by Olymp Trade can be executed only by fully competent adults. Transactions with financial instruments offered on Olymp Trade involve substantial risk and trading may be very risky. If you make Transactions with the financial instruments offered on Olymp Trade, you might incur substantial losses or even lose everything in your Account. Before you decide to start Transactions with the financial instruments offered on Olymp Trade, you must review the Service Agreement and Risk Disclosure Information. Olymp Trade is operated by Saledo Global LLC; Registration number: 227 LLC 2019; Registered Office Address: First Floor, First St. Vincent Bank Ltd Building, P. O Box 1574, James Street, Kingstown, St. Vincent & the Grenadines.