
![]() English
English ![]() हिन्दी
हिन्दी ![]() Indonesia
Indonesia ![]() Tiếng Việt
Tiếng Việt
The Stochastic Oscillator is no stranger to traders, but combining them with Support and Resistance is probably the first time you hear. This is one of the most likely single indicators that can be effective.
Stochastic Oscillator indicator will indicate whether the market is entering a cycle of either oversold or overbought. At the same time, the Support / Resistance indicator will let you know in which zone the price is fluctuating. And to identify a case where the price breaks the Support/Resistance lines and does not reverse, you will capture the Stochastic and Support / Resistance combination signals.
Register Olymp Trade & Get Free $10,000 Get $10,000 free for newbies
Stochastic with Support and Resistance
Support and Resistance
Needless to say about support and resistance specializing in finding reversal points, this is a basic indicator that everyone knows. But if you do not know it, you can read through the article: https://traderrr.com/support-and-resistance-how-to-find-and-how-to-use-it/.
Stochastic
When trading, general patterns show that the price will only fluctuate in a certain area, which is the Support and Resistance indicator. You will see reversal points when the price is about to touch thresholds with a potential high reversal. But how can you realize that the price will cross the threshold instead of a reversal? The Stochastic indicator is helpful in this situation!
If you do not know the Stochastic indicator, please read through the article: https://traderrr.com/stochastic-oscillator-an-accurate-reverse-indicator/.
How to use Stochastic indicator in combination with Support and Resistance indicators
Stochastic indicator setting:% K-14 and% D-3.
Register Olymp Trade & Get Free $10,000 Get $10,000 free for newbies
To ensure accuracy, you should trade a period 5-7 times longer than the one trading session (Candlestick Time).
The first thing you need to do is to have a reasonable time period to create the right support/resistance line. You should choose the range of the creation of support/resistance lines from 15 sessions or more. The maximum number of sessions is up to you, Traders often use a number of sessions between 15-40.
Make an Up / Buy trades
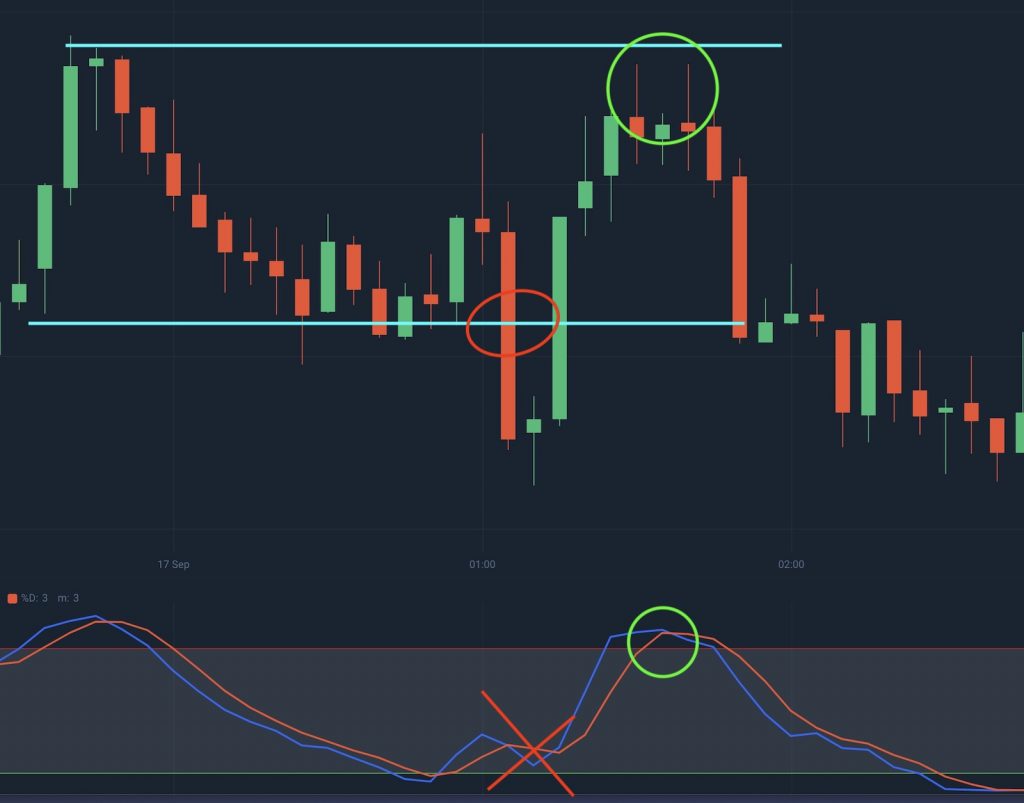
A signal appears when the price is about to touch the support line. Besides, at the same time, the Stochastic indicator stood out of the oversold zone and showed signs of turning back to the stable zone. This is a signal that the price will not exceed the threshold but will reverse to stabilize the market. If it’s not, do not make a trade.
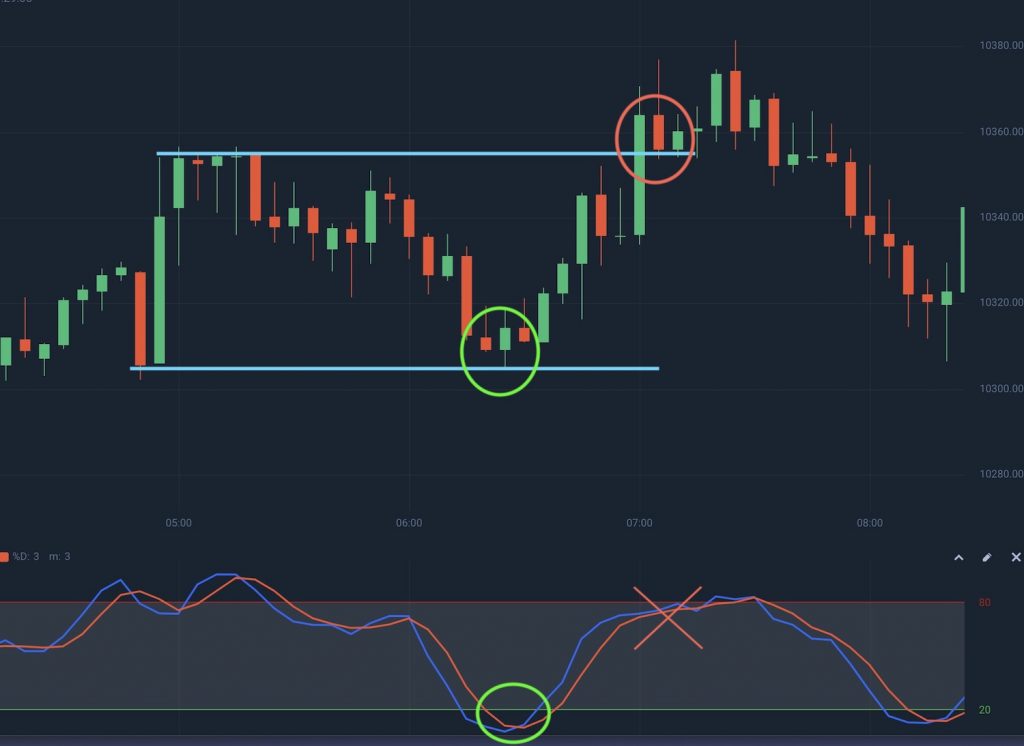
Down / Sell signal entry
Once the price hits the Resistance this is a ready signal for a Down / Sell order. However, to be sure that the price will not cross the resistance line, you need to check the Stochastic line. If the Stochastic indicator line is in the overbought zone, there is a sign of turning into a stable zone. Once the overbought line is cross, you should open a buy transaction immediately.
![]() English
English ![]() हिन्दी
हिन्दी ![]() Indonesia
Indonesia ![]() Tiếng Việt
Tiếng Việt


")


")
 General Risk Notification: Transactions offered by Olymp Trade can be executed only by fully competent adults. Transactions with financial instruments offered on Olymp Trade involve substantial risk and trading may be very risky. If you make Transactions with the financial instruments offered on Olymp Trade, you might incur substantial losses or even lose everything in your Account. Before you decide to start Transactions with the financial instruments offered on Olymp Trade, you must review the Service Agreement and Risk Disclosure Information. Olymp Trade is operated by Saledo Global LLC; Registration number: 227 LLC 2019; Registered Office Address: First Floor, First St. Vincent Bank Ltd Building, P. O Box 1574, James Street, Kingstown, St. Vincent & the Grenadines.