
![]() English
English ![]() हिन्दी
हिन्दी ![]() Indonesia
Indonesia ![]() Tiếng Việt
Tiếng Việt ![]() العربية
العربية
Tweezer Tops and Bottoms is known as a pattern that determines the bottom and top of a trend. Also known by names such as Railroad Tracks Pattern or Railway Track Candlestick Pattern.
What are Tweezer Tops and Bottoms?
Meaning of Tweezer Tops and Bottoms Candlesticks
The Tweezer candlestick pattern is a common pattern at the peak and bottom of a trend. For the uptrend, it is Tweezer Tops, when bulls take the price higher. In contrast, they are Tweezer Bottoms in the downtrend, when bears control the price to lower. Tweezer’s timing shows that the price has hit a top/bottom and will reverse.
Register Olymp Trade & Get Free $10,000 Get $10,000 free for newbies
How to define Tweezer
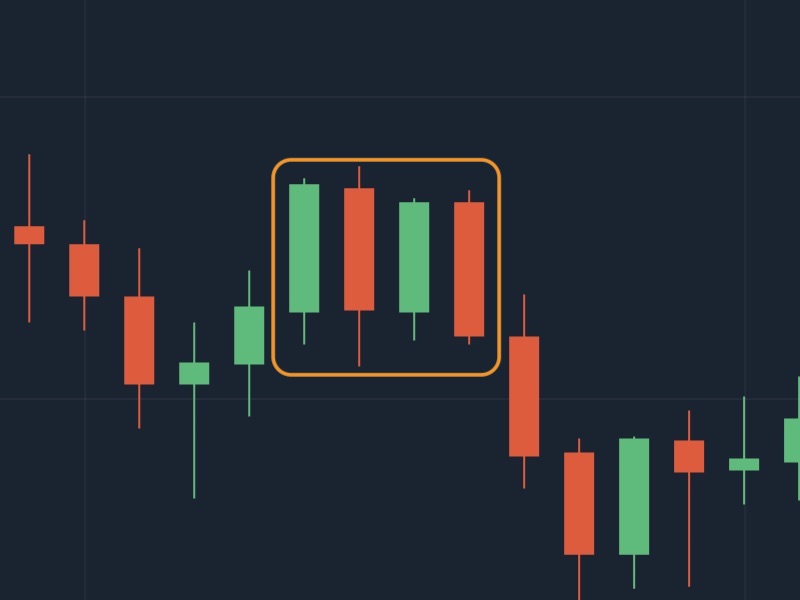
The pattern of Tweezer is two or more opposing long candles in turn have the same size, which usually occurs at the peak of an uptrend and the bottom of a downtrend. Then the price will reverse the opposite direction, helping the Traders to predict the market trend.
- How to identify Tweezer Tops: In an uptrend, there appear two or more candles with consecutive long bodies in opposite directions.
- How to identify Tweezer Bottoms: When in a downtrend, two or more candles with opposite bodies appear with similar body length characteristic.
They are about the same size and almost parallel. So that is also known as Railroad Tracks Pattern or Railway Track Candlestick Pattern.
Register Olymp Trade & Get Free $10,000 Get $10,000 free for newbies
How to use the Tweezer Tops and Bottoms candlestick pattern
The peak of the uptrend
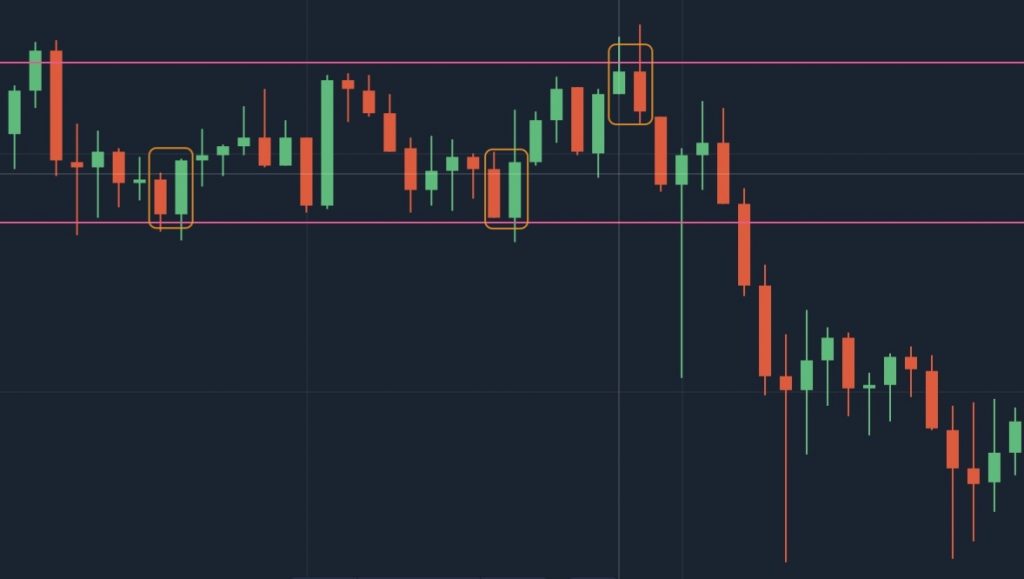
Resistance is often combined when trying to trade with the Tweezer Tops pattern. When Tweezer appeared near the Resistance threshold, the price reached its peak and was about to turn to the downside. At this point, you should execute a sell order to take profit.
The bottom of the downtrend
Trading with the Tweezer Bottoms pattern occurs at the bottom of the downtrend. When Tweezer Bottoms occurred at the Support threshold, the price bottomed out and was about to reverse to the upside. You should make a buy to speculate on hoarding.
Time per session with Tweezer
Trading with Tweezer Tops and Bottoms is good for short term sessions like 1 minute, 5 minutes. Transactions with longer periods of time will affect pattern accuracy in a bad way.
Uses different indicators and patterns
The Tweezer model has relatively good accuracy when it comes to support for other indicators and models. This means that you cannot trade well if you rely solely on Tweezer. Combine with many other indicators and effective patterns such as RSI, CCI, MACD, Williams,… bring more advantages in trading.
![]() English
English ![]() हिन्दी
हिन्दी ![]() Indonesia
Indonesia ![]() Tiếng Việt
Tiếng Việt ![]() العربية
العربية


")
 General Risk Notification: Transactions offered by Olymp Trade can be executed only by fully competent adults. Transactions with financial instruments offered on Olymp Trade involve substantial risk and trading may be very risky. If you make Transactions with the financial instruments offered on Olymp Trade, you might incur substantial losses or even lose everything in your Account. Before you decide to start Transactions with the financial instruments offered on Olymp Trade, you must review the Service Agreement and Risk Disclosure Information. Olymp Trade is operated by Saledo Global LLC; Registration number: 227 LLC 2019; Registered Office Address: First Floor, First St. Vincent Bank Ltd Building, P. O Box 1574, James Street, Kingstown, St. Vincent & the Grenadines.