
Why should investors understand how to read charts?
The chart shows the realtime price and changes of the asset over time. It gives you an overview to spend time doing statistical analysis, thereby predicting the direction of the asset movement.
The constantly updating ability charts depends a lot on the technicalities of the trading platform you use. At OlympTrade, the price is constantly updated 4 times 1 second.
By choosing a timeframe, you can determine the trend of the asset you are following depending on whether you are intending to trade short-term, medium-term or long-term. Long-term trading is suitable for slow growth that can take weeks or months to be profitable. While short-term trading tends to be profitable in a short period of time, this is generally not recommended.
Register Olymp Trade & Get Free $10,000 Get $10,000 free for newbies
What types of charts are there?
There are 4 most popular chart types and all of them are available on the Olymp Trade platform.
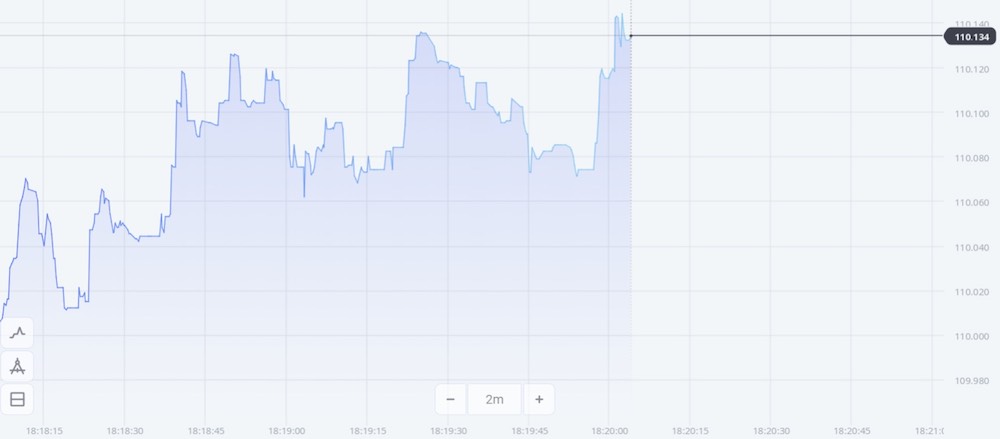
Line Chart (Area Chart)
This is the easiest chart to use because the line chart clearly shows the change in price. The closing price points are connected by a straight line and so you can clearly tell whether the price is going up or down.
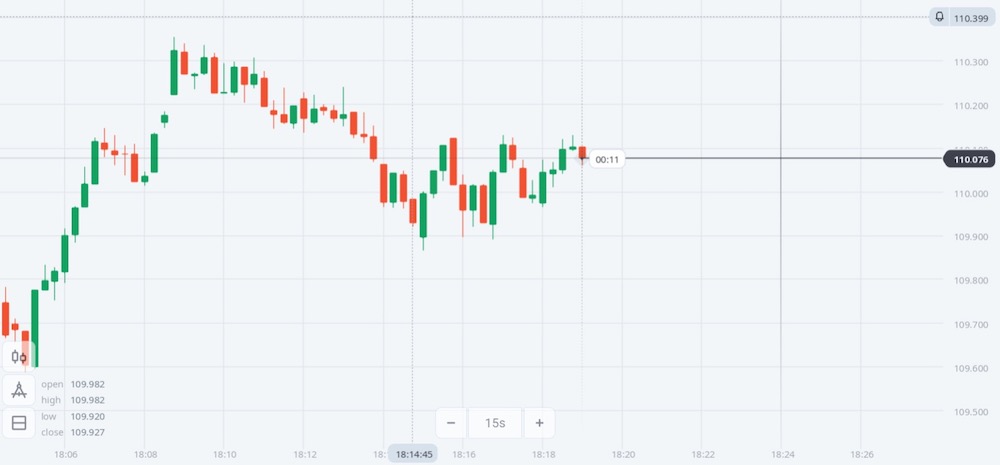
Japanese candlestick chart
Candlestick charts are more informative. Traders can see the opening, closing, high and low prices of an asset. A bullish candle is a green candle indicating that the price of the session was up, while a red color bearish candle shows that the price of the session was down.
A green candle represents an uptrend as buyers push the price up. The lower border of the candle will show the opening price, and the upper border is the closing price. At the bottom and top of the candle, there are wicks showing the highest price and the lowest price of the session.
In contrast, red candle shows the opposite, the top of the candle is the opening price while the bottom is the closing price.
Candlestick charts aka candlestick charts are a type of financial chart used to depict the price movement of a security based on past patterns.
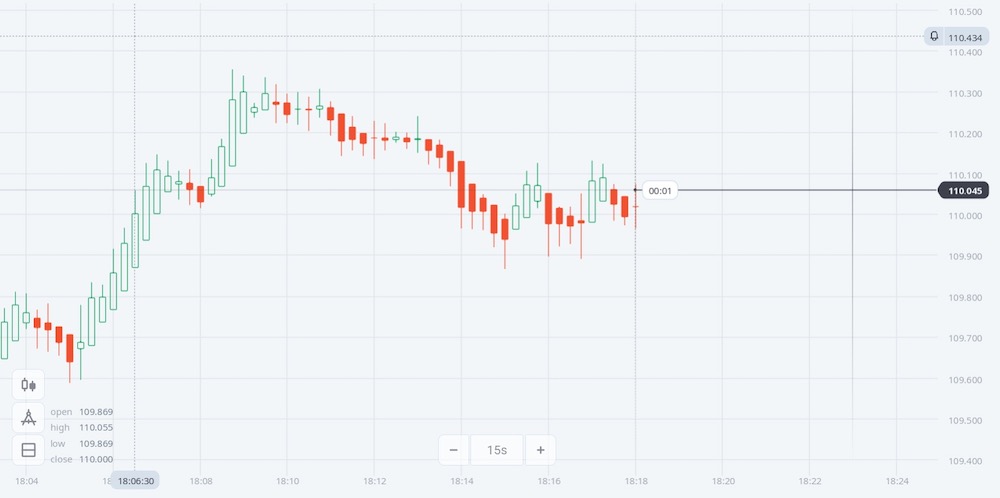
Heiken Ashi candlesticks
It looks like the average Japanese candlestick chart but it is actually the indicator. It simplifies trend analysis, so it helps a lot in determining the next direction of the market. This type of candle allows you to filter out noise and track trends more clearly.
Register Olymp Trade & Get Free $10,000 Get $10,000 free for newbies
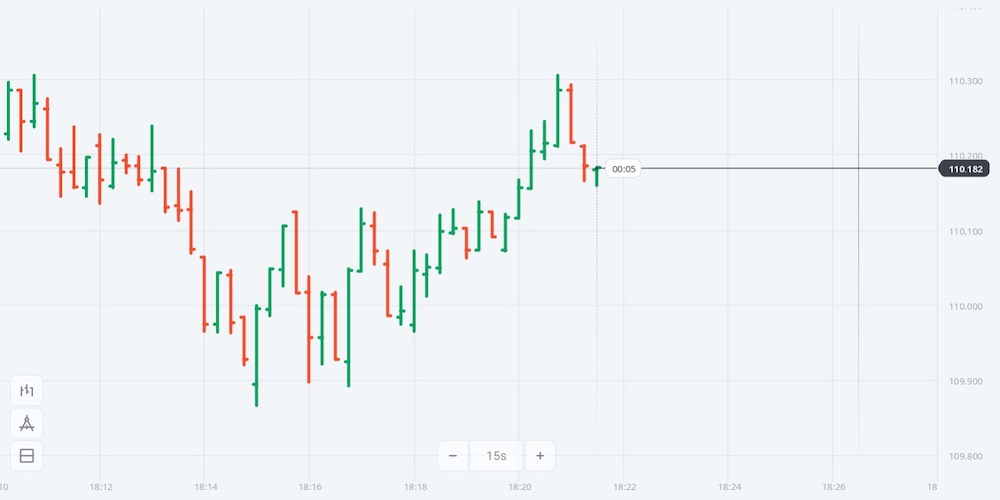
Bar Chart
At first glance, this chart seems to be quite complicated but basically it just has a different appearance from Japanese candlesticks. To determine changes in session prices, you need to look at the side of the vertical column. In the protruding position is the opening price point and the closing price point called “ears.”
How do traders use technical analysis?
This is how technical analysis helps investors, the focus is on:
- Calculating everything possible, it includes a lot of things like economics, politics, psychology, …
- Market movements are always within specific molds.
- History will repeat itself, so based on movement we can predict future trends.
Graphical analysis
This style of analysis is directly related to the drawing tools, they are available at the Olymp Trade trading platform. With that support, you can build your own as few patterns as you see fit.
Trend line
Paying attention to the trend line, investors can determine whether the product value is increasing or decreasing. If the trend is going up, we call it a positive. If they are trending downward, it is a negative. And there are sometimes when the trend is an unpredictable horizontal line.
Support and Resistance
Support and Resistance are conditional boundary of the highest value and lowest value over custom period of time.
Support is the horizontal line located at the lowest price of the current price zone, and Resistance is the horizontal line located at the highest price position. The price will tend to move evenly in the band make by them. The best time to trade is when the price hits the threshold and turns back inside the zone. Sometimes the price lightly moves in the area between support and resistance, we call it Flat.
When support or resistance levels repeat over and over, they are strong Resistance/Support levels. And vice versa, it is a weak level if there is low repetition.
Register Olymp Trade & Get Free $10,000 Get $10,000 free for newbies
Candlestick patterns and Graphical patterns
There are many technical analysis metrics that can be detected through candlestick charts. Each pattern has its own characteristics and can represent trend continuation and reversal points. Doji candlestick pattern, Three black crows pattern and Cloud patterns are pretty good examples in this case.
There are graphical patterns such as Head and Shoulders, Flags and Double Top Patterns that allow you to calculate long-term trading.
And if it comes to mathematical analysis, we will have Fibonacci levels, indicators (indicators) and oscillators (oscillators).
Mathematical analysis
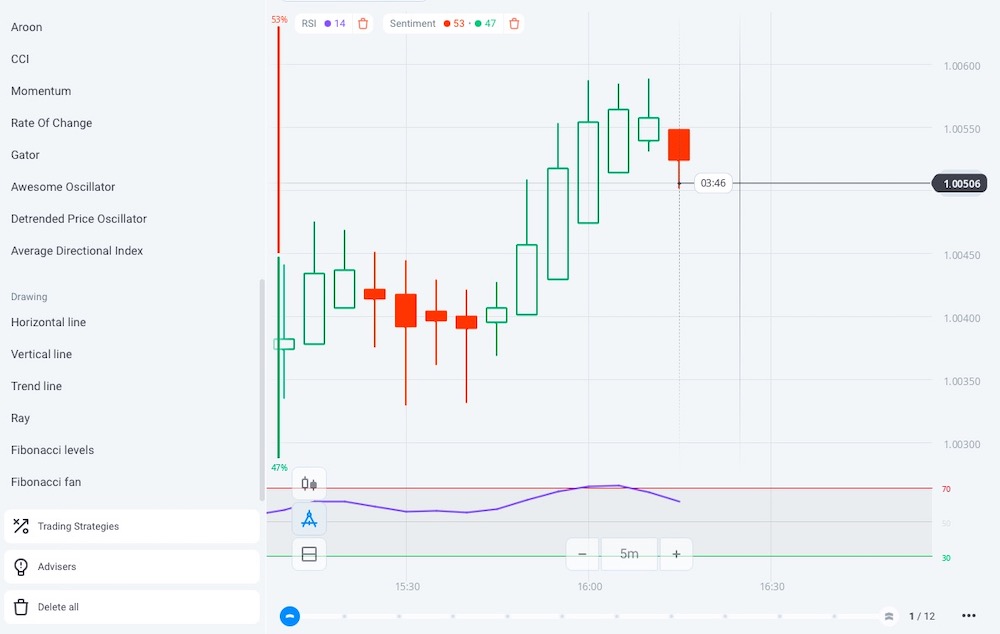
There are more sophisticated tools that are also used to analyze graphs based on complex associative mathematical calculations. Some technical analysis tools such as Fibonacci levels and Fibonacci fans. With the help of these two indicators, you can calculate the appropriate place where the price will continue to grow or reverse. You can read more about them through the article Here
Indicators are another mathematical analysis tools. The Olymp Trade platform offers a lot of options and valuable tips to using them.
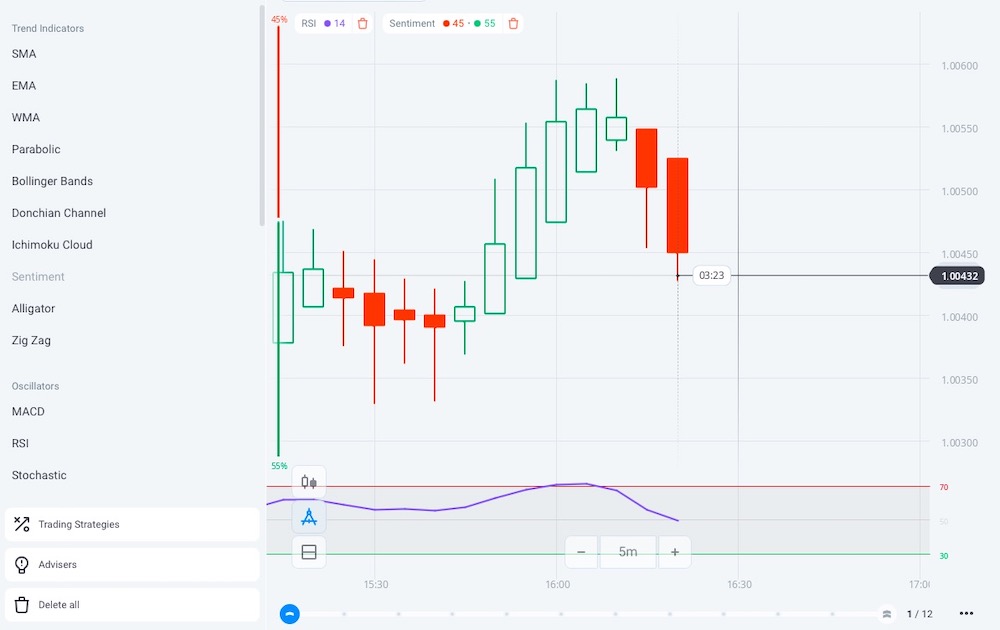
Popular indicators like Simple Moving Average (SMA), Ichimoku Cloud, Alligator, Bollinger Bands and many more for you to learn. There are many trend indicators that show trend movement and can point to possible reversal points.
A group of these Indicators are called Oscillators, they are extremely beneficial in many situations where the trend cannot be clarified by just one indicator. For example, the RSI measures an asset’s overbought or oversold levels, which can be useful for predicting the likelihood of future changes.
There are popular oscillators such as Bollinger Bands, STARC Bands. You can learn them, they allow you to find the reversal point of the current trend with a relatively high degree of accuracy.
Conclusion
The ability to read stock charts is one of the keys to make investor success. Of course, it also depends a lot on learning and practice and also on your agility.
The Olymp Trade Demo account is a great opportunity to boost your chart reading skills without any fees. You need to practice more and more until you are ready, at this time the world of investors will open up before your eyes without you having to depend on any individual or organization. The decision is up to you.


")
 General Risk Notification: Transactions offered by Olymp Trade can be executed only by fully competent adults. Transactions with financial instruments offered on Olymp Trade involve substantial risk and trading may be very risky. If you make Transactions with the financial instruments offered on Olymp Trade, you might incur substantial losses or even lose everything in your Account. Before you decide to start Transactions with the financial instruments offered on Olymp Trade, you must review the Service Agreement and Risk Disclosure Information. Olymp Trade is operated by Saledo Global LLC; Registration number: 227 LLC 2019; Registered Office Address: First Floor, First St. Vincent Bank Ltd Building, P. O Box 1574, James Street, Kingstown, St. Vincent & the Grenadines.