
![]() English
English ![]() हिन्दी
हिन्दी ![]() Indonesia
Indonesia ![]() Português
Português ![]() Tiếng Việt
Tiếng Việt ![]() العربية
العربية ![]() ไทย
ไทย
Olymp Trade provides its clients with a huge variety of different trading tools on their platform. One of the most unique is the DeMark Oscillator, which helps traders identify when markets are overbought, oversold, beginning new trends, and/or experiencing a trend reversal.
What is the DeMark Oscillator?
The DeMark Oscillator was created by one of the true innovators and pioneers of trading, Thomas DeMark. DeMark is responsible for a number of systems and strategies for analyzing market trends to create an understanding where trends were developing and when reversals would occur.
His analysis was sought after by many leading trading houses and the analytical tools that he had developed. Many of these tools are secretive or are extremely expensive to acquire, but several of his methods are widely available today for free such as the Tom Demark Indicator (DeMark Oscillator), which is available to Olymp Trade clients for free.
Register Olymp Trade & Get Free $10,000 Get $10,000 free for newbies
Other techniques and strategies like TD Sequential Indicator, DeMark Pivot Point Calculator, and the Demark Trendline Indicator are readily available online for traders wanting to develop detailed analysis skills.
The DeMark Indicator helps traders determine the best entry and exit points in the market in order to maximize their profitability. By taking data from previous timeframes, the indicator shows when markets are becoming overbought and oversold similar to other oscillators like the Relative Strength Index (RSI), but with different calculations.
How does it work on Trading?
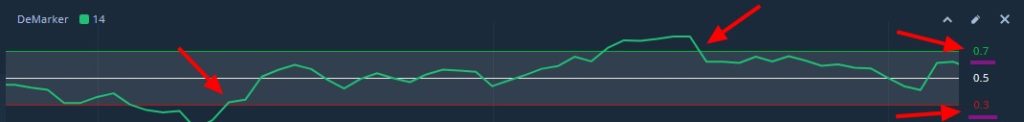
The DeMark Oscillator is displayed by a set of values between 0 and 1. The base point on the indicator is .5 (center) and .3 and .7 on the indicator show points where the market may be oversold (.3) or overbought (.7).
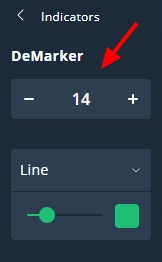
The formula for determining these values is based on the preceding 14 periods by default, but can be expanded or contracted if the trader desires.
The indicator doesn’t have any smoothing typically, but the Olymp Trade model utilizes simple moving averages to smooth the chart. Additionally, the indicator can be displayed as a line or a histogram.
The indicator doesn’t calculate the closing levels of previous periods. It uses the highest and lowest trading points within those periods. Here is how it evaluates prices and creates a value when comparing two trading periods:
Register Olymp Trade & Get Free $10,000 Get $10,000 free for newbies
Numerator
- If the new trading high is more than the previous period, the difference between the two prices is given.
- If the new trading high is lower than the previous period, a value of 0 is given.
- This is done for each of the previous 14 periods (in the standard setting).
- The result is a Maximum average for the 14 periods and gives the calculator a numerator.
Denominator
- If the new trading low is lower than the previous period, the difference between the two prices is given.
- If the new trading low is higher than the previous period, a value of 0 is given.
- This is done for each of the previous 14 periods (in the standard setting).
- The result is a Minimum average for the 14 periods and this number is added to the Maximum average to give us our denominator.
Register Olymp Trade & Get Free $10,000 Get $10,000 free for newbies
Calculation
- The numerator is then divided by the denominator to give us a value between 0 and 1.
Formula
DeMarker Indicator = Avg Max Value / (Avg Min Value + Avg Max Value)
Fortunately, the indicator does all the calculations for the trader, which simplifies the process.
How to use the DeMark Oscillator when trading?
The DeMark Oscillator is most effective in a fast moving market and in conjunction with other indicators. Traders are advised to use it to determine trend reversal pivot points or in identifying new trends as they develop.
When day trading on the Fixed Time or Forex side of the Olymp Trade platform, look for points on the indicator below .3 or above .7. When the indicator moves past these points, it is a good sign that an entry or exit point in a position is best.
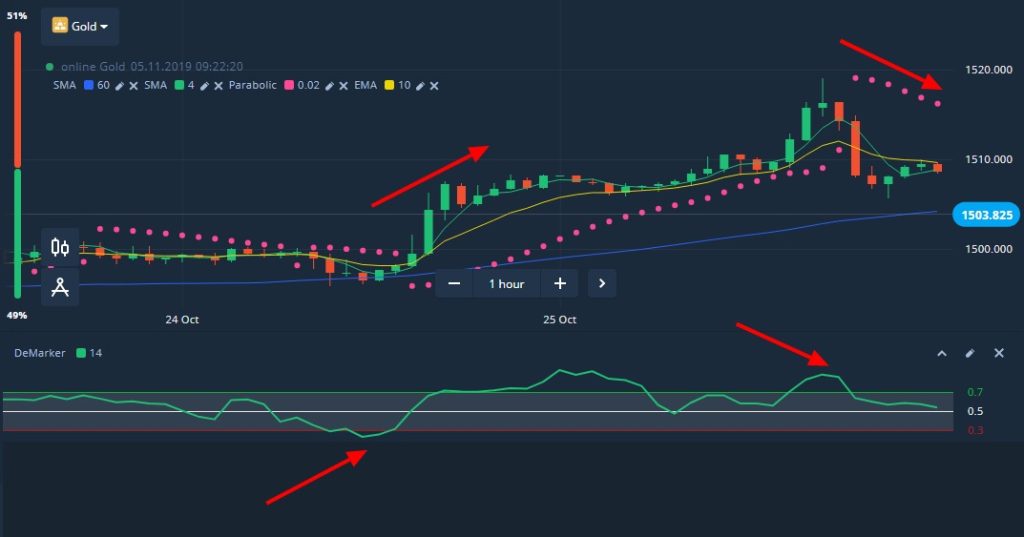
In the screenshot above, the red arrows near the DeMarker Indicator show points of entry for traders as they signal upward and downward trends as they crossover into the grey area of the indicator. The arrows on the price chart show what happened shortly after the Demark Oscillator provided us with the Buy and Sell entry points.
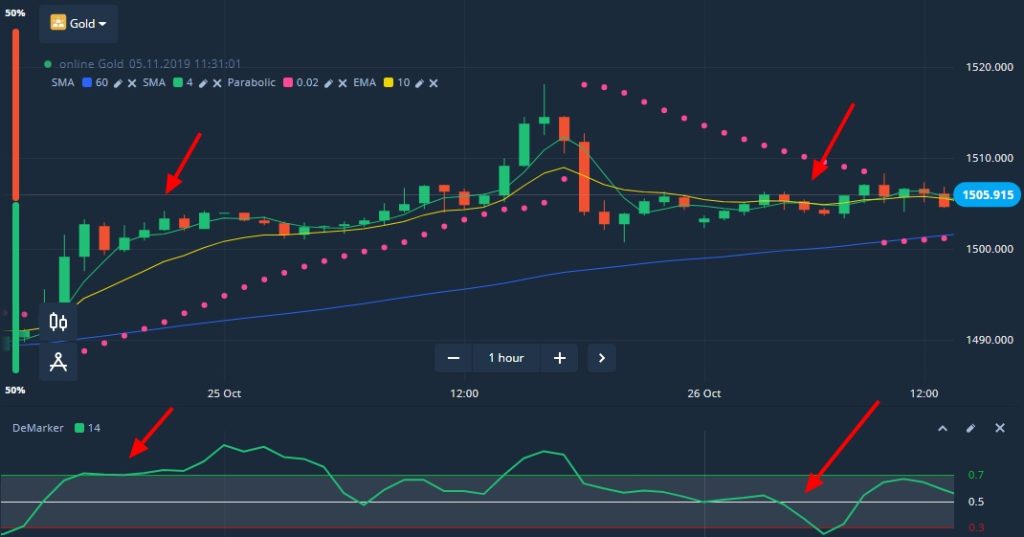
Conversely, the indicator also provided us with proper exit timing for our positions. As illustrated below, the red arrows show where the indicator showed that the price was moving towards overbought and oversold territory allowing us to close the positions profitably.
One tool doesn’t make a toolbox
While the DeMarker Oscillator is a valuable tool, it isn’t perfect. It is best used in conjunction with other tools like the RSI, CCI, Williams% and other tools when making trading decisions. Learning how to incorporate it into a strategy is highly recommended.
Of course, there is no “best” strategy or tool, but using the DeMark Oscillator as part of strategies such as Fibonacci Pivot Points, Camarilla Pivot Points, and DeMark Analysis, traders can reduce their risk of loss while improving their market timing.
![]() English
English ![]() हिन्दी
हिन्दी ![]() Indonesia
Indonesia ![]() Português
Português ![]() Tiếng Việt
Tiếng Việt ![]() العربية
العربية ![]() ไทย
ไทย


")
 General Risk Notification: Transactions offered by Olymp Trade can be executed only by fully competent adults. Transactions with financial instruments offered on Olymp Trade involve substantial risk and trading may be very risky. If you make Transactions with the financial instruments offered on Olymp Trade, you might incur substantial losses or even lose everything in your Account. Before you decide to start Transactions with the financial instruments offered on Olymp Trade, you must review the Service Agreement and Risk Disclosure Information. Olymp Trade is operated by Saledo Global LLC; Registration number: 227 LLC 2019; Registered Office Address: First Floor, First St. Vincent Bank Ltd Building, P. O Box 1574, James Street, Kingstown, St. Vincent & the Grenadines.