
Technical analysis is the use of chart data to predict price movement direction. To master this, consider the main tools and techniques used for that.
Reading the Price Charts
Technical analysis is based on reading price charts. Area, Bars, Heiken Aishi, and the Japanese candlesticks are the four chart types available on the Olymp Trade platform.
Overall, Japanese candlesticks are most popular amongst traders as they are the easiest to read.
Register Olymp Trade & Get Free $10,000 Get $10,000 free for newbies
You could apply the chart type you want in the bottom-left corner of the chart area by clicking the Chart Types icon.
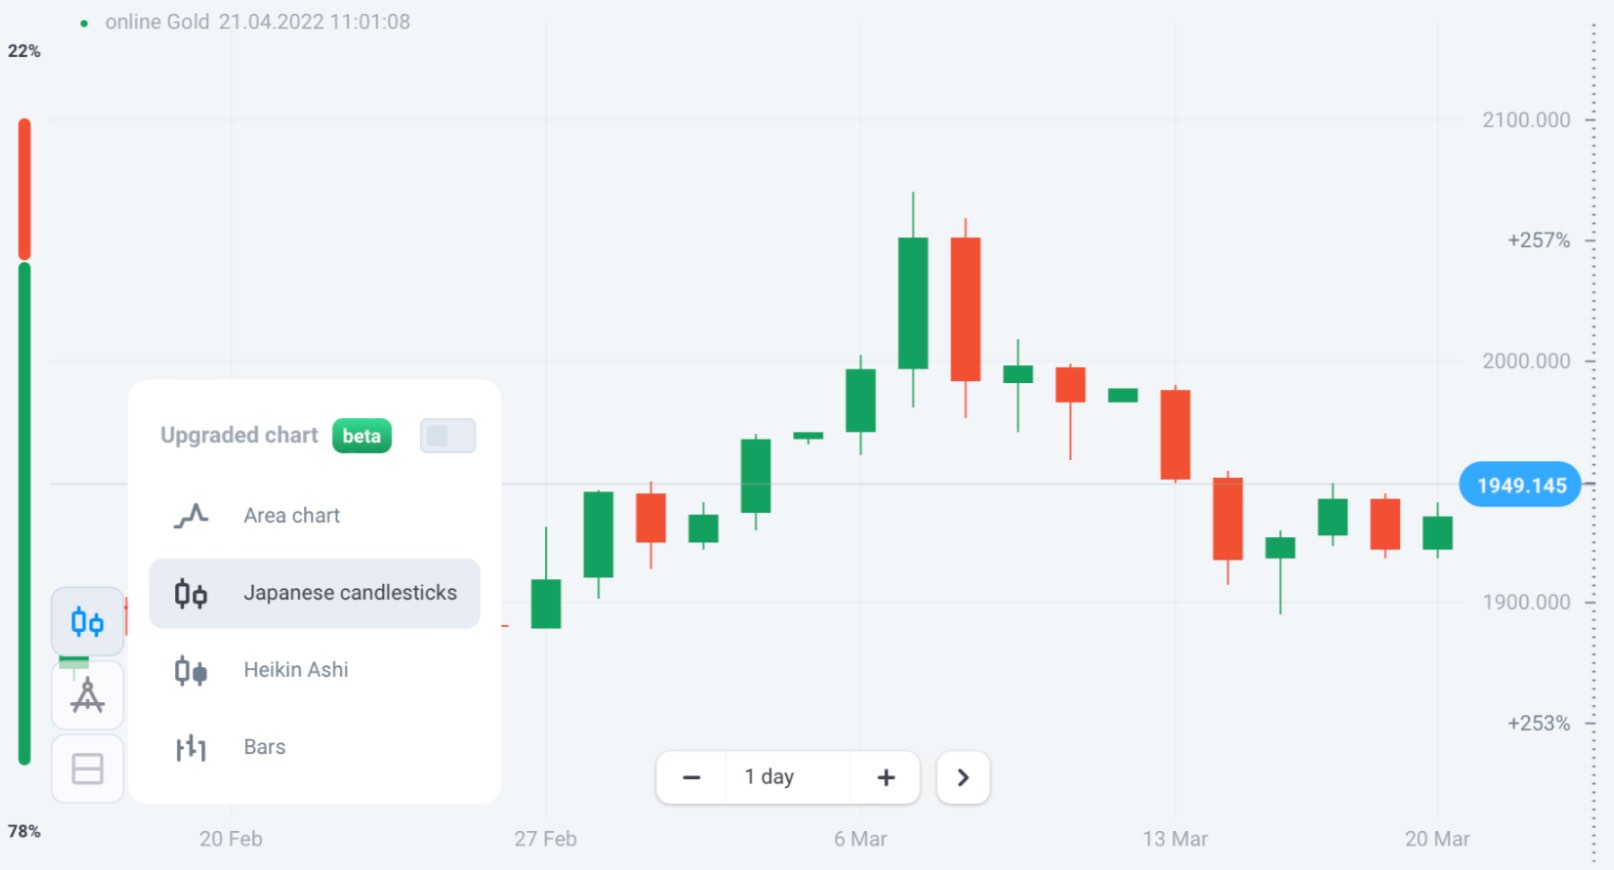
So, with the green candles, the opening price is at the bottom of the body, and the closing price is at the top of it. With the red candles, the top of the candle’s body shows the opening price, and its bottom is the closing price.
Each candlestick shows the price movement in a time frame. For example, the chart above is a daily gold price chart, where each bar shows how the market has corrected in a day. If it is a 5 minute time frame, each candle will show the price performance for 5 minutes and every 5 minutes a new candle will form. Using technical analysis for beginners will allow you to identify trends through a combination of these candlestick patterns.
Spotting Trends
A trend is recognizable when the price continues to move in some particular pattern for an extended period of time. In general, there can be an uptrend, a downtrend or a stable when the price is inside the horizontal channel.
On the chart below, long uptrends, steep downtrends, and plateaus are represented by the green, red, and purple lines, respectively.
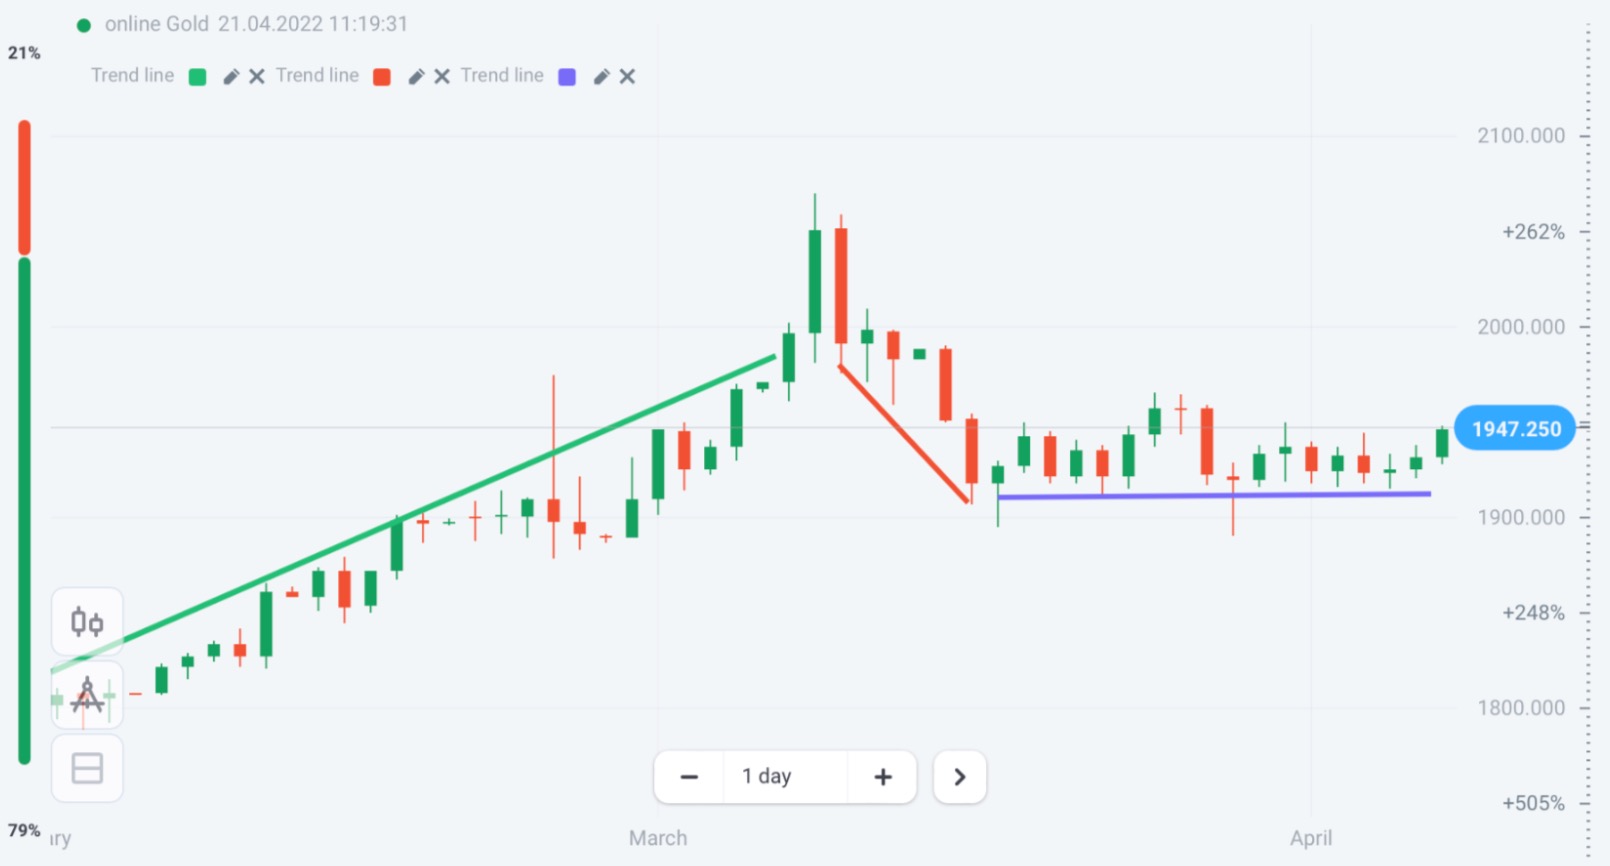
Technically, if you can connect a series of highs or lows into a line, that will be considered a trend. Most often, if there is one, it is easily visible on the chart like in the case above.
Support and Resistance Levels
Support and resistance levels are those where the price may pause or reverse direction.
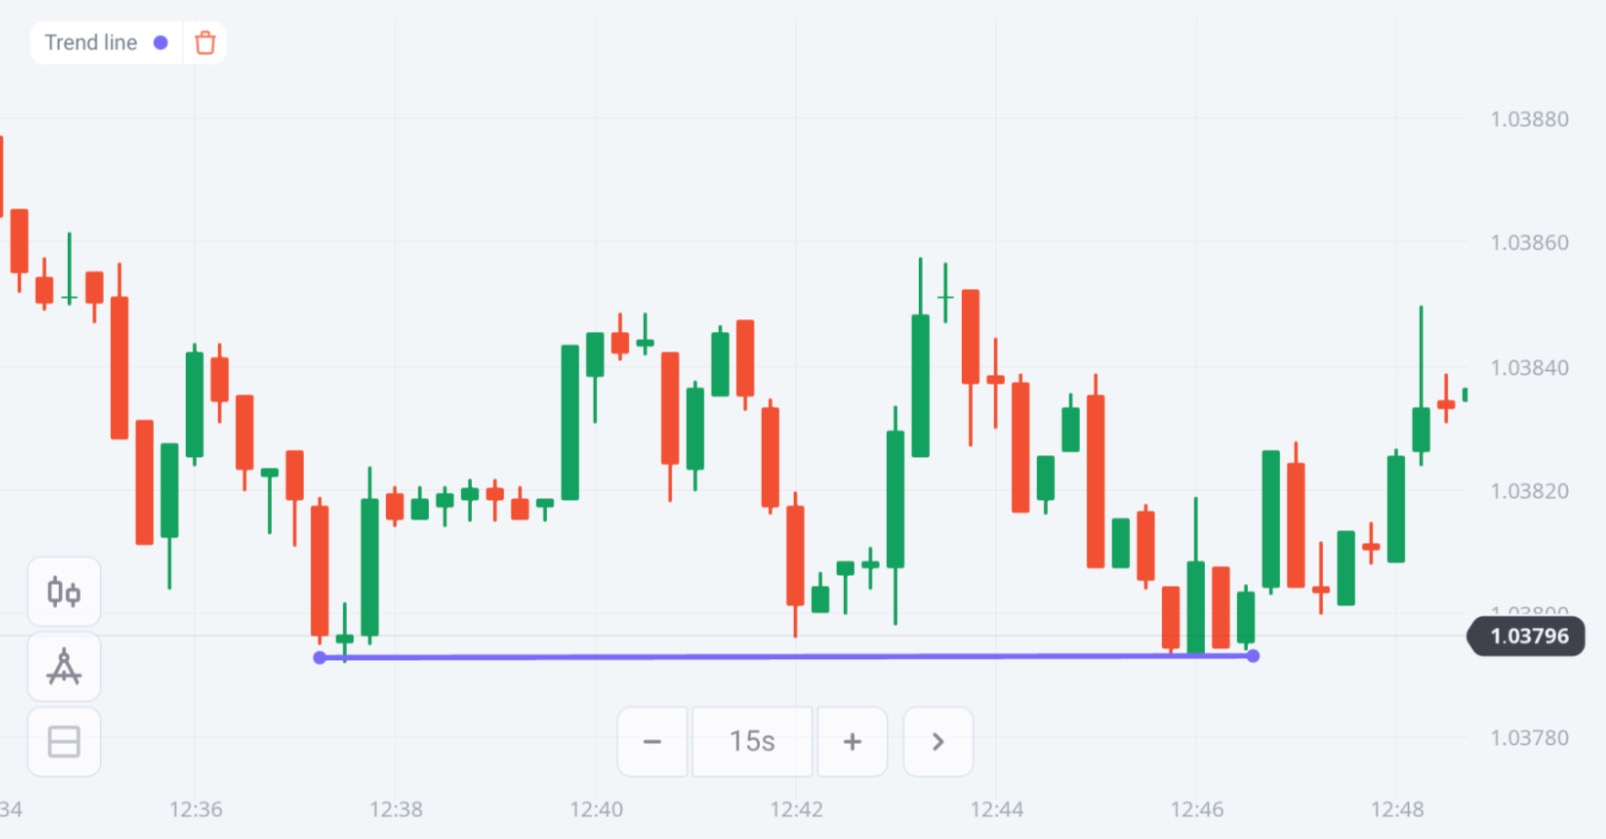
While support and resistance levels can coincide with trendlines, a single point reached by price on a chart can also create support or resistance.
Register Olymp Trade & Get Free $10,000 Get $10,000 free for newbies
Also, support and resistance levels sometimes change the position.
If price has tested the same support or resistance level multiple times, that level is generally considered a strong level. And conversely, they occur with low frequency is considered a weak level.
Pullbacks and Breakouts
Pullbacks and Breakouts are simple trading strategies based on trends and support and resistance levels.
Pullbacks
Pullback is short-term trend reversal. Opening a position against the trend, knowing that it will soon return to the main trend, is at the heart of this strategy.
A clear trend with support and resistance lines is top needed for this strategy.
The candlestick is reaching Support and resistance levels is a potential profit opportunity. Look for long wicks that represent a trend of price rejection and volume that increases as price approaches a bottom or ceiling. Technical analysis for beginners will help you identify trend lines and make the right choices.
For example, the longer the elapsed time between callbacks, the larger the callback opportunities. However each pullback creates its support or resistance level, reducing the likelihood of making a more profitable trade.
Trade when price is approaching a significant level in an attempt to capitalize on a full-blown pullback. Use previous support or resistance established at the highs or lows of previous pullbacks.
Register Olymp Trade & Get Free $10,000 Get $10,000 free for newbies
Breakouts
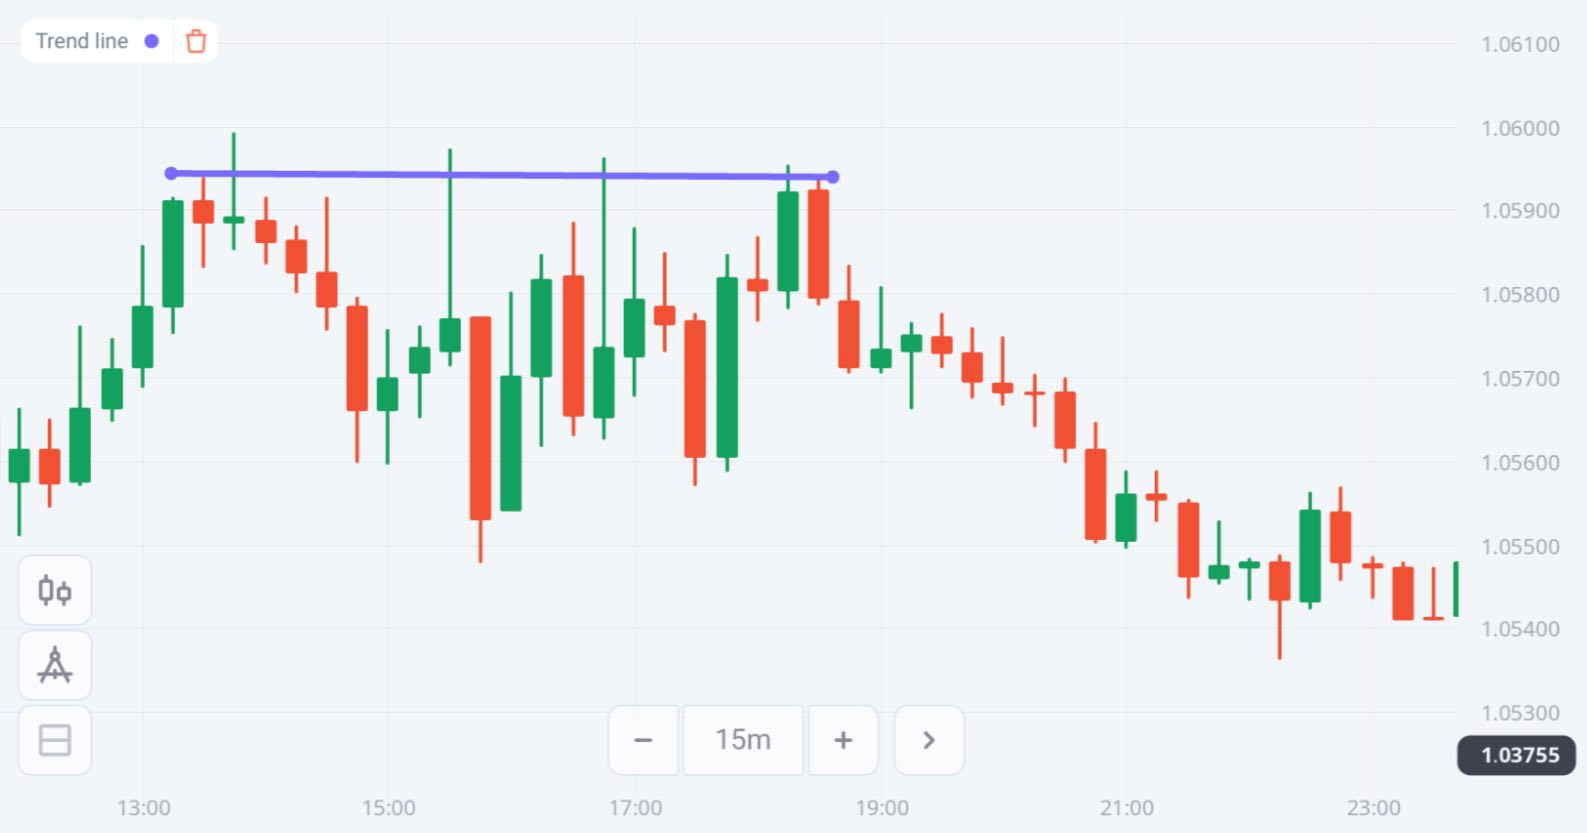
This strategy suggests opening trades that profit from the price movement that breaks its support or resistance level.
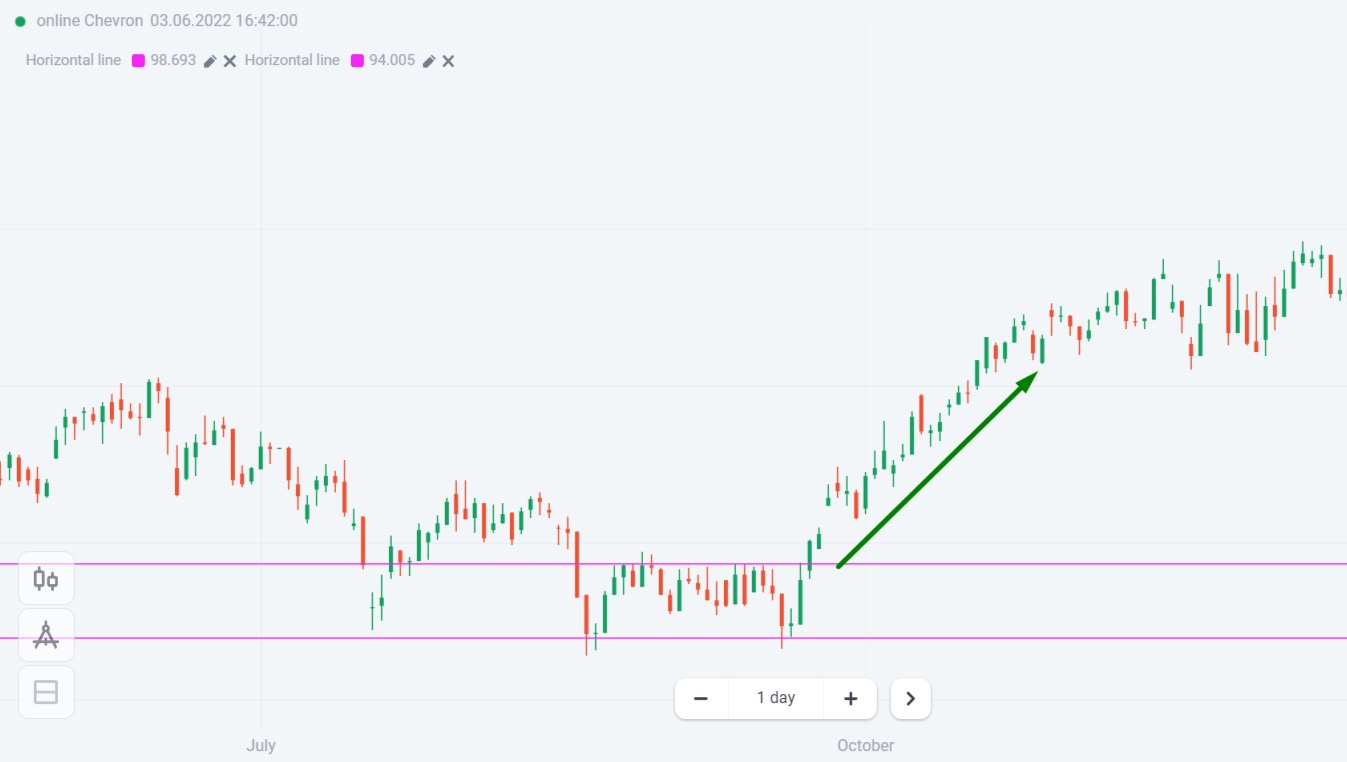
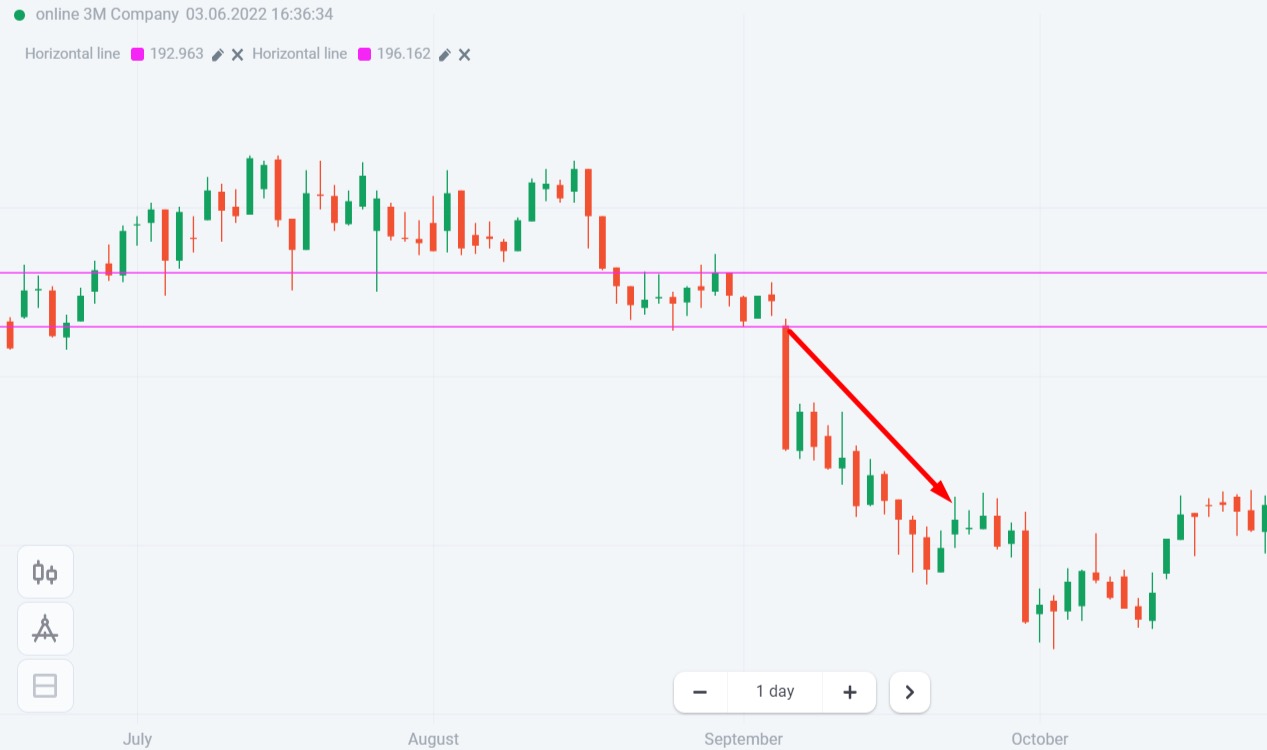
After such a breakout, the price volatility often increases and takes it further in the direction of the breakout.
When trading on breakouts, we need identify the current price trend, support and resistance levels first. That is necessary to plan entry and exit points. Unlike Pullbacks, Breakouts require a channel created by the support and resistance lines. This channel means prices are prepare for a large jump or drop after breaking through either barrier.
Technical analysis for beginners helps to analyze and identify support and resistance levels.
With both the Pullback and Breakout strategies, we can be ready to exit the trade when the momentum start to slow.
Also, when executing Fixed Time Trades following either strategy, set the trade duration equal with timetick as the chart’s Time Frame to minimize confusion and capture the full momentum of the candle.
There is a specific article about breakouts on the Blog, and we encourage you to review it for more details on this approach.
Register Olymp Trade & Get Free $10,000 Get $10,000 free for newbies
The Trend Is Your Friend
It is extremely beneficial for technical analysis to examine chart data for the purpose of forecasting the future price of a trading instrument. So you need to learn to understand charts well, follow trends, support and resistance levels. All that is required is skill and hours of practice.
Pullbacks and Breakouts are two basic technical strategies that use these core concepts and you can improve your skills with them on a Demo account to familiarize yourself with the market mechanics.
Remember that any skill is best honed in practice. This is especially true of forex technical analysis for beginners.


")
 General Risk Notification: Transactions offered by Olymp Trade can be executed only by fully competent adults. Transactions with financial instruments offered on Olymp Trade involve substantial risk and trading may be very risky. If you make Transactions with the financial instruments offered on Olymp Trade, you might incur substantial losses or even lose everything in your Account. Before you decide to start Transactions with the financial instruments offered on Olymp Trade, you must review the Service Agreement and Risk Disclosure Information. Olymp Trade is operated by Saledo Global LLC; Registration number: 227 LLC 2019; Registered Office Address: First Floor, First St. Vincent Bank Ltd Building, P. O Box 1574, James Street, Kingstown, St. Vincent & the Grenadines.