
The Aroon indicator is used to determine market trends as well as the direction and strength of price movements. Basically, it shows how trends weaken or strengthen over a certain period of time.
How it works
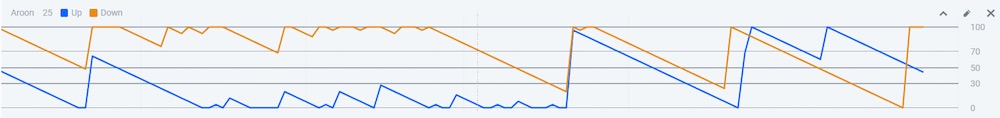
The Aroon indicator consists of two lines: Blue or green Aroon Up Line; and the Aroon Down line is red. Like most oscillators, both lines move in the range of 0 to 100.
The Aroon Up line shows how much time has passed since the highest price in a given time frame.
The Aroon Down Line calculates the amount of time that has passed since the lowest price drop in a given timeframe.
Formula
Aroon up = (Number of periods — the number of periods since the absolute maximum in the given period) / number of periods × 100
Aroon down = (Number of periods — the number of periods since the absolute minimum in the given timeframe) / Number of periods × 100
Register Olymp Trade & Get Free $10,000 Get $10,000 free for newbies
The main levels of the Aroon indicator are usually identified as 70, 50 and 30. These boundaries being crossed are a potential signal of a market trend.
For example, if one of the indicator lines is consistently above 70 and the second continues to stay below 30 or close to zero, there is a strong trend in the market. Also, if there is an uptrend in the market, the Aroon Up line will always be in the 100 range according to the respective candlestick chart, as the trend updates its peaks so quickly that each new candle will have a new peak value.
Indicator levels
If the indicator lines cross each other, it signals the start of a new trend or the end of a sideways market period. The following table explains the importance and meaning of each indicator level.
| Indicator line | Level | Meaning |
|---|---|---|
| Aroon Up | >70 | Strong uptrend |
| Aroon Up | 50 to 70 | Uptrend is gaining momentum |
| Aroon Up | 30 to 50 | Uptrend is continuing but losing momentum |
| Aroon Up | <30 | Buyers no longer dominate the market |
| Aroon Down | >70 | Strong downtrend |
| Aroon Down | 50 to 70 | Downtrend is forming |
| Aroon Down | 30 to 50 | Downtrend is losing momentum |
| Aroon Down | <30 | Sellers no longer dominate the market |
Register Olymp Trade & Get Free $10,000 Get $10,000 free for newbies
The default value of the indicator is 14, which reflects the timeframe used for the analysis. If you increase it, the indicator will be set to identify larger trends. The larger value commonly used is 25. Traders need to find the optimal indicator value for themselves after analyzing the trading history and testing many indicator values.
Setting the indicator value to 30 helps identify and trade major trends, but smaller trends will no longer be detected.
Signals
The first type of signal of the Aroon indicator shows bad values. In this case, the indicator lines are at opposite ends of the indicator window and reflect the current uptrend or downtrend.
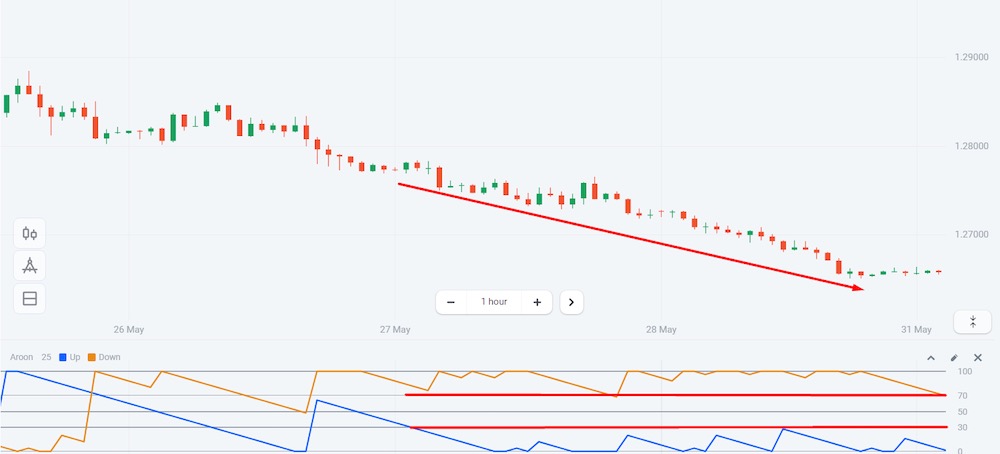
If Aroon Up is above 70 and Aroon Down is below 30, it is a signal of an uptrend.
If Aroon Up is below 30 and Aroon Down is above 70, it is a signal of a downtrend.
If Aroon Up breaks above 50, it means that the uptrend is facing resistance and may reverse downwards.
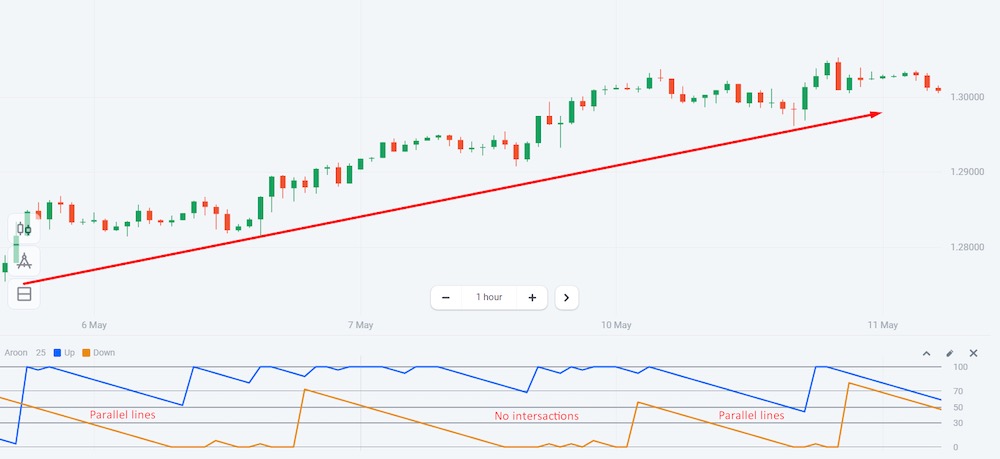
The second type of signal of the Aroon indicator is when its lines are parallel. It indicates that the current market trend is gaining momentum, detecting a strengthening signal.
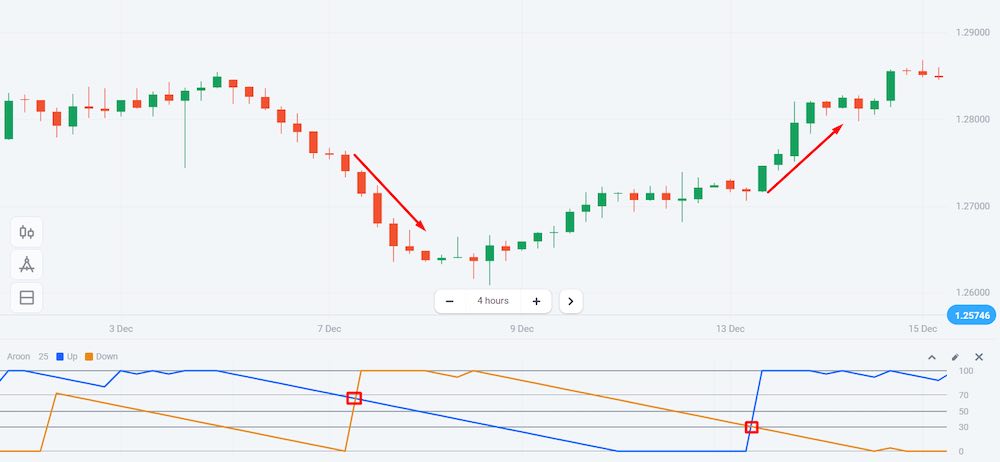
The third type of signal is when the Aroon indicator lines cross showing a long-term trend. This usually happens when Aroon Down goes up or Aroon Up goes down. The main factor that determines the third signal is the indicator lines between 30 and 70.
Conclusion
The benefit of the Aroon indicator is that it helps in determining the direction of market trends and their strength. In addition, the Aroon indicator is very useful in identifying the end of a sideways market period and can be incorporated well into any trading strategy. During practice, like any other technical tool, you should use it in conjunction with other indicators to increase efficiency.


")
 General Risk Notification: Transactions offered by Olymp Trade can be executed only by fully competent adults. Transactions with financial instruments offered on Olymp Trade involve substantial risk and trading may be very risky. If you make Transactions with the financial instruments offered on Olymp Trade, you might incur substantial losses or even lose everything in your Account. Before you decide to start Transactions with the financial instruments offered on Olymp Trade, you must review the Service Agreement and Risk Disclosure Information. Olymp Trade is operated by Saledo Global LLC; Registration number: 227 LLC 2019; Registered Office Address: First Floor, First St. Vincent Bank Ltd Building, P. O Box 1574, James Street, Kingstown, St. Vincent & the Grenadines.