
StochRSI is basically a combination of two oscillators, Stochastic and RSI. Created by famous US traders and technical indicator developers Stanley Kroll and Tushar Chande. StochRSI is said to combine the best qualities of the two oscillators and identify overbought and oversold periods with greater accuracy.
Using Stochastic RSI
There are two ways to subscribe to the StochRSI indicator. First, you can buy it on Olymp Trade’s marketplace with a monthly subscription of $6.
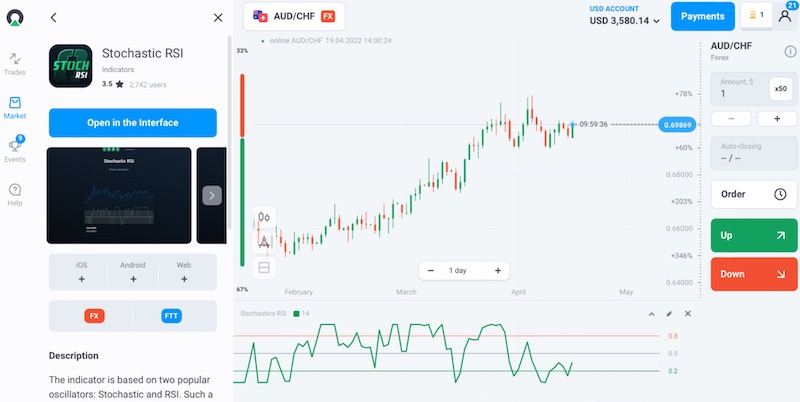
The second way to get the StochRSI indicator is to reach the third milestone from Beginner to Advanced by Trader’s way, after which it will be donated to your account.
Register Olymp Trade & Get Free $10,000 Get $10,000 free for newbies
Set up StochRSI
To find the StochRSI indicator on Olymp Trade, access the technical analysis tools by tapping the compass symbol in the bottom left corner of the main screen. A list of indicators will appear on the left sidebar, with Stochastic RSI below the Oscillator sector.
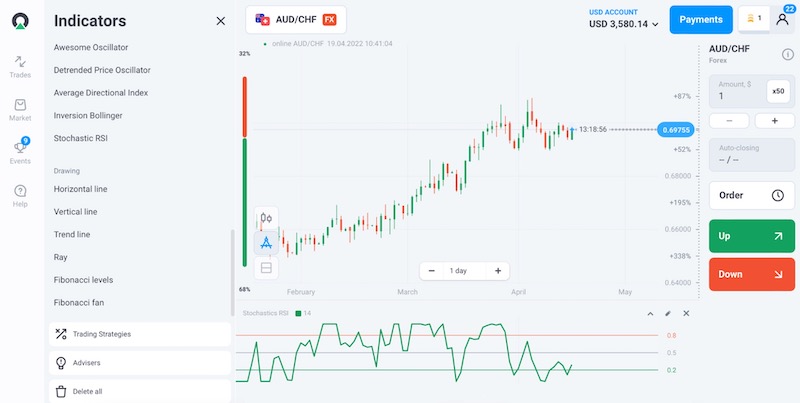
By default, the timeframe of the StochRSI indicator is 14, as this is the recommended value. You can change it by clicking on the pencil symbol in the upper right corner of the indicator chart.
How to use Stochastic RSI
Overbought and oversold zones
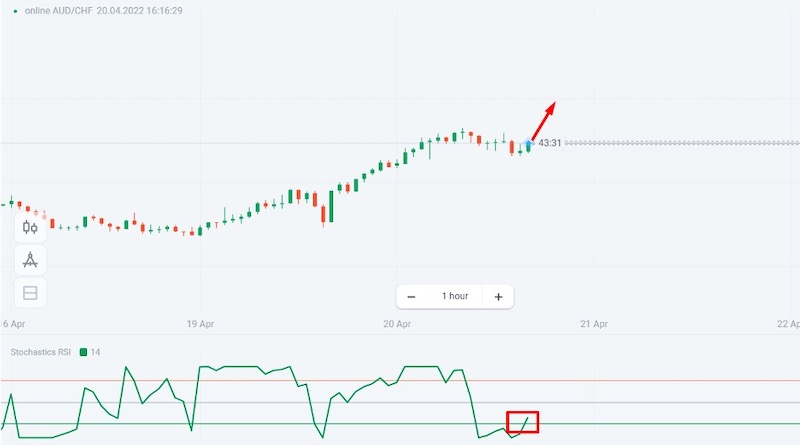
For the first type signal provided by this indicator, the two overbought and oversold zones on the StochRSI chart are key.
The upper zone above 0.8 is the overbought zone and the lower area below 0.2 is the oversold zone. It is generally considered a signal to open a trade when the indicator turns back from either of those zones into the middle zone, between 0.2 and 0.8.
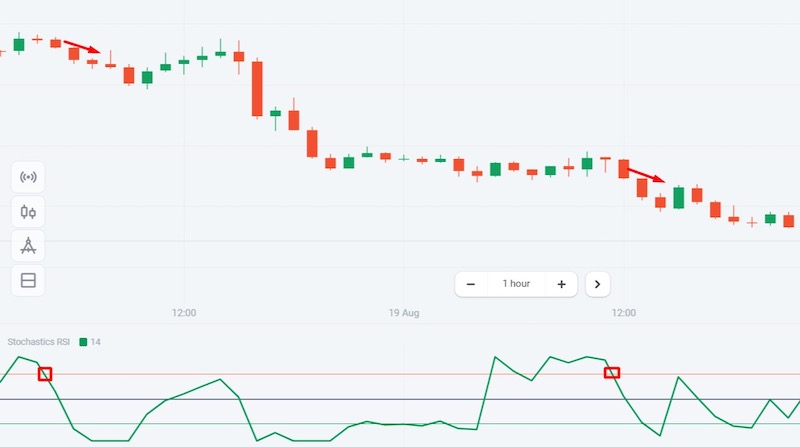
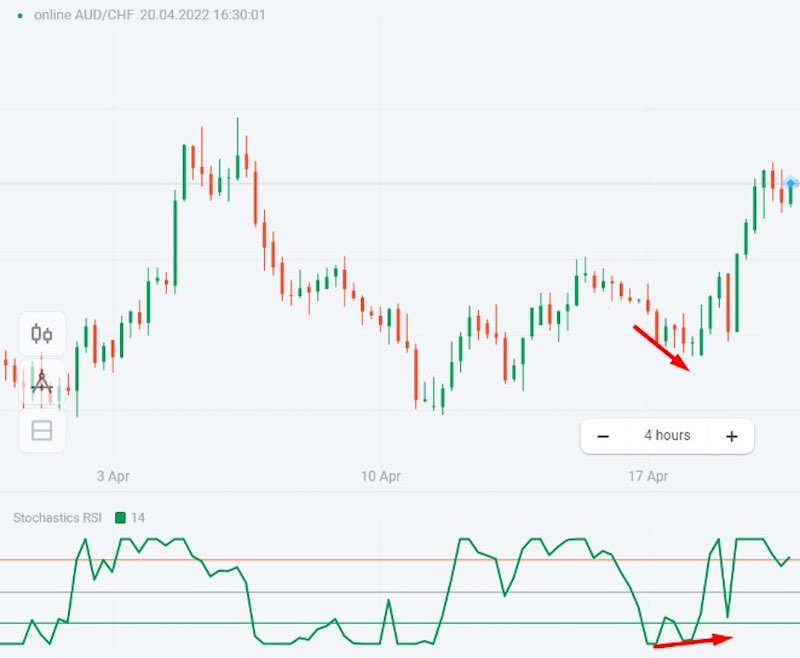
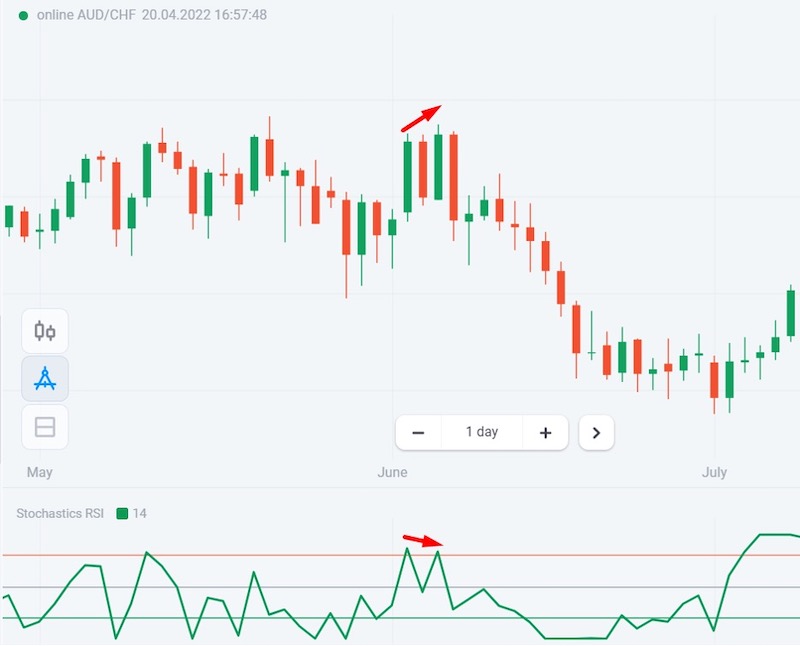
Divergence point
The second type of StochRSI signal is a divergence. Divergence is when the indicator line and price move in opposite directions. For example, if the price goes up while the indicator goes down or vice versa, it is a divergence.
Practice more
Stochastic RSI is a very useful and popular indicator, but it is not the only one. Research them through our blog posts to find the ones that best suit your needs.


")
 General Risk Notification: Transactions offered by Olymp Trade can be executed only by fully competent adults. Transactions with financial instruments offered on Olymp Trade involve substantial risk and trading may be very risky. If you make Transactions with the financial instruments offered on Olymp Trade, you might incur substantial losses or even lose everything in your Account. Before you decide to start Transactions with the financial instruments offered on Olymp Trade, you must review the Service Agreement and Risk Disclosure Information. Olymp Trade is operated by Saledo Global LLC; Registration number: 227 LLC 2019; Registered Office Address: First Floor, First St. Vincent Bank Ltd Building, P. O Box 1574, James Street, Kingstown, St. Vincent & the Grenadines.