
Note: This article is for new investors.
During this decade, stocks were seen as the most popular form of investment. By gaining experience to analyze stocks will help you be more confident in your selection and maximize your income.
First, You will approach two forms of fundamental analysis and technical analysis. We will start with technical analysis, a type of analysis that relies solely on statistical patterns.
Technical analysis of stocks
Technical analysis helps a trader to make a decision to buy or sell a stock. With this method, you will analyze the price movement of a stock and determine the direction the price will move in the future.
Fortunately, in these few decades, numerous techniques have been developed that form highly accurate prediction patterns. What you need to do is to memorize and use them during trading.
These are called indicators, patterns. By using statistical probability formulas based on the asset’s price history, it is possible to predict the direction of the asset. These tools are completely provided by the Olymp Trade platform, free of charge.
Technical analysis tools are also used by investors who want to buy and hold stocks for the long term, while for traders they are useful to determine which stocks will yield a profit. beneficial in the short term. With technical analysis, we can determine the right time to enter the market and the right time to exit the market.
Register Olymp Trade & Get Free $10,000 Get $10,000 free for newbies
Technical analysis indicators for stock trading
In general, technical indicators provide an overview of a stock’s supply and demand as well as a psychological picture of the market. There are two basic types of technical analysis indicators that you need to know:
Overlays
The lines determine whether the stock price goes up or down. The overlay can be seen above or below the candle or bar. For example, we have Moving averages and Bollinger Bands.
Oscillators
Oscillators appear separate from price movement charts and identify the beginning or end of a trend. Examples are Stochastic oscillator, MACD or RSI.
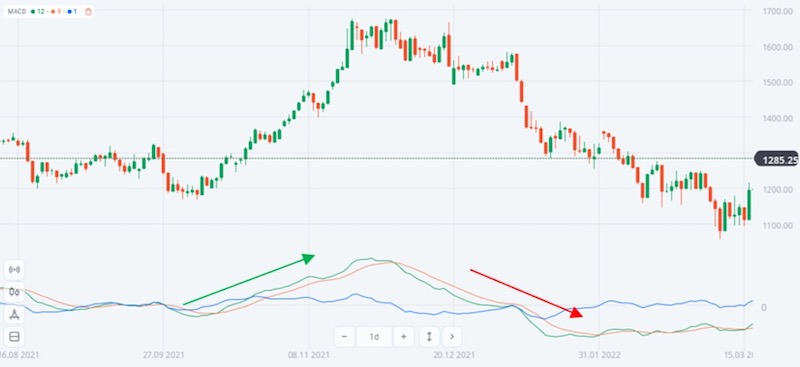
MACD
MACD is used to show trend strength. This indicator consists of two lines, the MACD line and the slower moving signal line.
When above zero, the signal line indicates an uptrend is in progress. Moreover, if the line is below zero, a downtrend is in progress.
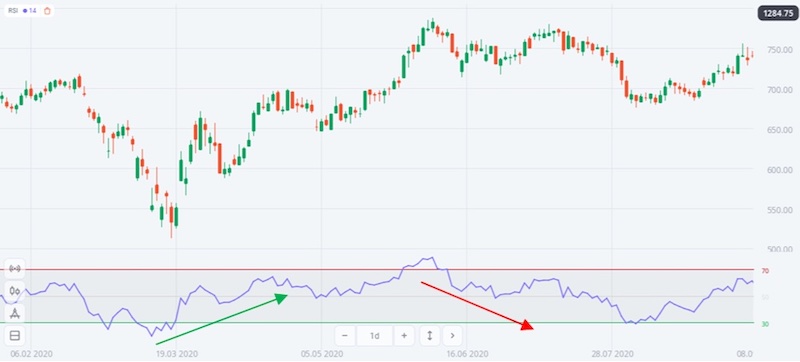
Relative Strength Index (RSI)
RSI is a reference line for performing technical analysis of stocks and is in the form of a mid or zero. By default, the RSI is at 30 and 70 and indicates overbought and oversold conditions. If the price reaches or exceeds 70 on the RSI, the asset is considered overbought. Conversely, if the price reaches or falls below 30, the asset is considered oversold.
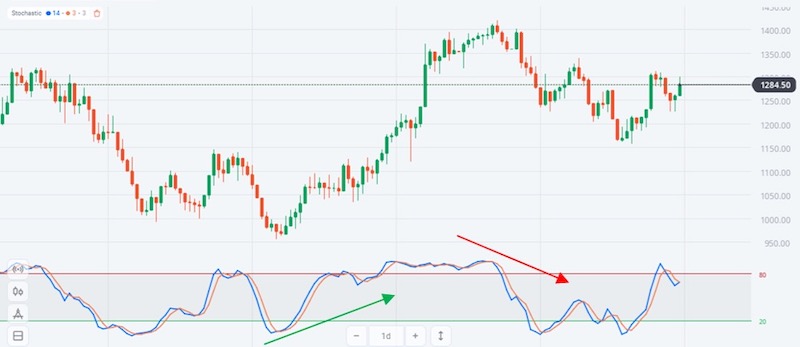
Stochastic oscillator
This indicator is used to measure the current price relative to the price range for a certain period of time. Similar to the RSI, the Stochastic Oscillator consists of two lines located at the 0 and 100 positions. These lines are usually colored blue and red. If the blue line is above the red line, it signals an uptrend, while the blue line crossing the red line means that the trend is likely to go down.
Conducting technical analysis of stocks
To do stock analysis, you can start by looking at market movements, familiarize yourself with technical analysis indicators, and see how history repeats itself. Olymp Trade supports a Demo account with an asset of 10000$ to help you practice more easily.
Make sure you use market movements as a reference when doing your analysis, as price movements themselves also reflect current conditions. They can be caused by a number of factors such as natural disasters, politics and the psychological state of market participants. This is why it’s important to stay on top of the news, ride out waves of volatility and develop a deep understanding of trading psychology – specifically your own.
Register Olymp Trade & Get Free $10,000 Get $10,000 free for newbies
Guide for a basic technical analysis method:
- Observe the trend occurring on the stock’s price chart.
- Place support and resistance levels on the chart for clearer buy and sell signals.
- Use the moving average to determine if a stock is in an uptrend or downtrend.
- Use the oscillator to determine the possibility of a change in the current trend.
- Set a minimum price limit or Stop Loss to minimize losses in stock trading.
Conclusion
History always repeats itself, technical analysis tools highlight repeating patterns in stock prices thus making it easier to successfully trade stocks.
It is important to use the indicators that best suit your needs to identify investments and trades quickly and accurately.
However, technical analysis is not the answer to all trader successes. We also recommend that you familiarize yourself with fundamental analysis techniques to help guide your investment decisions.
Join Olymp Trade, take advantage of the many available trading tools and achieve remarkable results in the market!


")
 General Risk Notification: Transactions offered by Olymp Trade can be executed only by fully competent adults. Transactions with financial instruments offered on Olymp Trade involve substantial risk and trading may be very risky. If you make Transactions with the financial instruments offered on Olymp Trade, you might incur substantial losses or even lose everything in your Account. Before you decide to start Transactions with the financial instruments offered on Olymp Trade, you must review the Service Agreement and Risk Disclosure Information. Olymp Trade is operated by Saledo Global LLC; Registration number: 227 LLC 2019; Registered Office Address: First Floor, First St. Vincent Bank Ltd Building, P. O Box 1574, James Street, Kingstown, St. Vincent & the Grenadines.