
The Average Daily Range(ADR) indicator is one of the best technical indicators for short-term trading. It uses a unique formula to detect market conditions and has become popular with short-term traders for its accuracy.
But, it’s not good for your e-wallet if you go into it without fully understanding how it work. In this post, we describe the ADR for Forex and effective methods to use this popular technical tool in short-term trading.
What is the ADR indicator?
The ADR indicator is a technical indicator that helps financial investors measure an asset’s price volatility. The average daily range formula is not too complicated, as it calculates the difference between the asset’s high and low prices within a particular period and detects any significant change in the price action of an asset in the shorter term. With the ADR indicator’s unique calculation, there’s no wonder why this handy tool is a top choice for day traders.
Register Olymp Trade & Get Free $10,000 Get $10,000 free for newbies
Using the ADR indicator in trading
The ADR is often used as a support indicator. It does not provide the correct signal to open Up or Down trades. Applying the ADR calculator on forex or stock can confirm whether to hold long or short positions on assets and sometimes determine where to place Stop Loss and Take Profit levels. The ADR indicator, along with the balance volume, open interest and ZigZag indicator are widely used on the Olymp Trade platform. Like the ADR, the Gator Oscillator and other oscillators have the same properties as the auxiliary indicators.
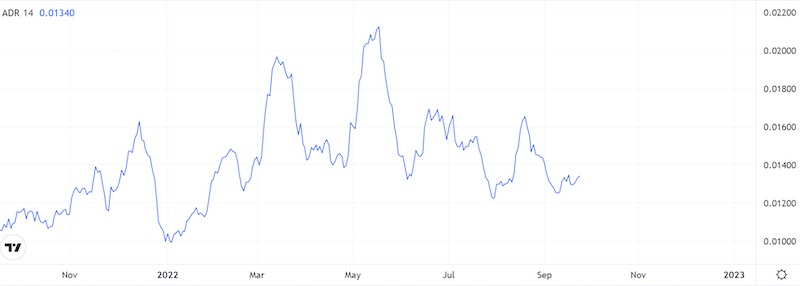
As seen above, the ADR indicator has charted a fairly normal line. It has peaks and dips whose depth depends on the distance between the highest highs and lowest lows in the selected time period.
There are three important observations to note before we move on to analyzing the indicator in relation to price:
- The indicator increases or decreases regardless of whether the price increases or decreases. If the indicator rises, then the trend is considered strong and trades should be opened within that trend. If it decreases, the trend is weak and trades should not be opened.
- The ADR indicator may lag significantly behind real time, so you should not rely on it completely.
- The ADR indicator should not be used during economic events or news events. The market’s volatility will be high, which means that the indicator is likely to give many false signals.
Using ADR for trading Up
The EUR/USD currency pair experienced strong growth between 2005 and 2008. However, using the ADR indicator, this growth can be broken down into several sections:
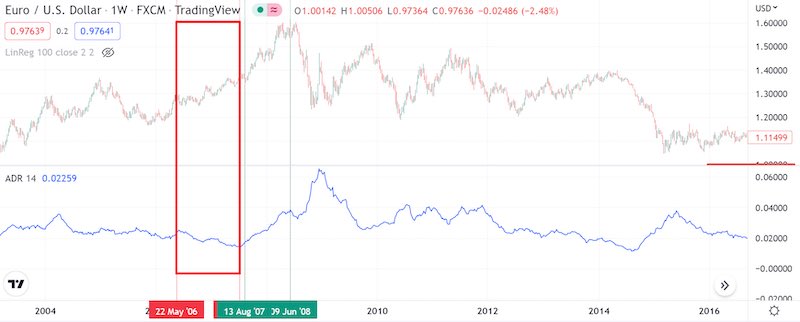
In the highlighted section, the price of the asset is increasing, but at the same time, the ADR indicator is decreasing, which confirms either the weakness of the trend or a delay in the reversal of the indicator. In such a case, opening Up trades is not recommended.
Register Olymp Trade & Get Free $10,000 Get $10,000 free for newbies
The second section highlighted below is characterized by a growth in the ADR indicator, which means that you can open an Up trade until the indicator shows a reversal.
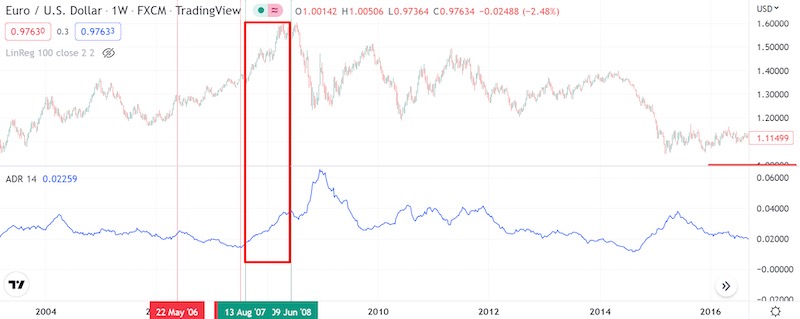
Indeed, if we had not used the ADR indicator, it would have allowed us to earn much more, but without it, the risks in such a position would have been greater.
We used long-term trends for this guide section, so let’s talk about shorter timeframes.
Using ADR for trading Down
We can analyze how the indicator behaves using EUR/USD as an example. We know that had a strong bearish trend in EUR/USD began around May 2021. From March to April 2022, the ADR indicator reversed and began to downward. This was a good signal for Down position.
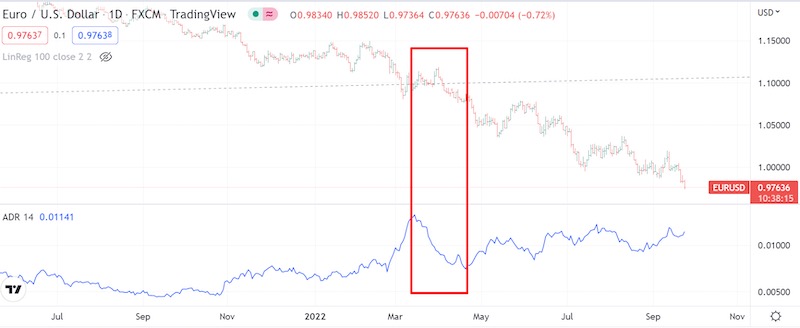
As the ADR subsequently started rising again, this is a new signal to open Down trades.
Practice more
Now you know all the basics about the ADR indicator. Following the guidelines above will increase your profitability and reduce risks on capital.
But you should have a solid risk management plan in place and keep an eye out for volatility. We suggest mastering these concepts via sufficient practice before putting them in real trades.


")
 General Risk Notification: Transactions offered by Olymp Trade can be executed only by fully competent adults. Transactions with financial instruments offered on Olymp Trade involve substantial risk and trading may be very risky. If you make Transactions with the financial instruments offered on Olymp Trade, you might incur substantial losses or even lose everything in your Account. Before you decide to start Transactions with the financial instruments offered on Olymp Trade, you must review the Service Agreement and Risk Disclosure Information. Olymp Trade is operated by Saledo Global LLC; Registration number: 227 LLC 2019; Registered Office Address: First Floor, First St. Vincent Bank Ltd Building, P. O Box 1574, James Street, Kingstown, St. Vincent & the Grenadines.