
![]() English
English ![]() हिन्दी
हिन्दी ![]() Indonesia
Indonesia ![]() Português
Português ![]() Tiếng Việt
Tiếng Việt ![]() العربية
العربية ![]() ไทย
ไทย
Fibonacci
A lot of methods of analysis, which you can use to determine the future trend, predict a company’s cash flow or know the fair value of a stock, are based on mathematics.
You may think that your lack of grasp of mathematics will prevent you from making money by trading in the financial markets. However, do not jump to conclusions. You can use ready-made methods of asset price analysis.
Register Olymp Trade & Get Free $10,000 Get $10,000 free for newbies
Fibonacci trading is an example of how a complex method has become convenient and easy to apply. Thanks to programmers, traders received several reliable tools for price analysis.
In short, the idea of Fibonacci is based on the “golden ratio” – the ideal proportion of a part of an object to its entire form. When applying this method to trading, we generate lots of price benchmarks that can affect the trend.
The Fibonacci sequence is the series of numbers: 1, 2, 3, 5, 8, 13, 21, etc. Each next number is the sum of two previous ones.
In this article, we will analyze the two most popular approaches: using Fibonacci levels and a Fibonacci Fan — another market analysis tool. Traders use them to find the price levels where they could open positions counting on a new trend. You will find out:
- How to set up the tools on a chart.
- How to place a stop loss and take profit.
- How to find strong support and resistance levels.
- What you can combine Fibonacci analysis with.
Fibonacci levels
Fibonacci levels are a complex of horizontal lines at different distances from each other. They appear in the chart automatically after a low and a high have been connected (or a high and a low if there is a downtrend).
Register Olymp Trade & Get Free $10,000 Get $10,000 free for newbies
Each horizontal level is assigned a value from 0 to 1. Traders also qualify these benchmarks as important and auxiliary ones. This relative division is confirmed by historical data analysis.
| 1 (or 100%) | the endpoint of calculations |
| 0,7639 (or 76,39%) | an auxiliary level |
| 0,618 (or 61,8%) | an auxiliary level |
| 0,5 (or 50%) | an important level |
| 0,382 (or 38,2%) | an important level |
| 0,236 (or 23,6%) | an important level |
| 0,16 (or 16%) | an auxiliary level |
| 0 (0%) | the starting point of calculations |
Examples
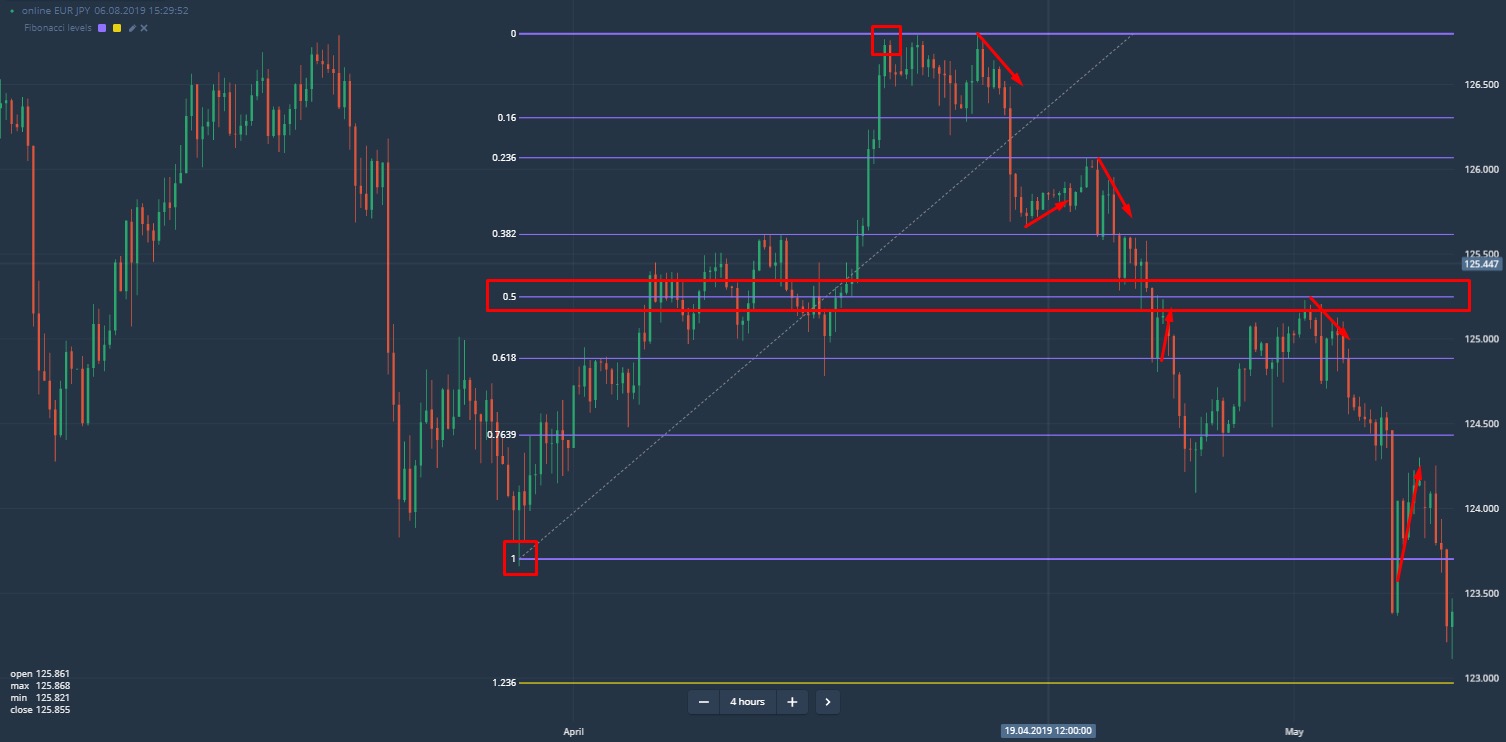
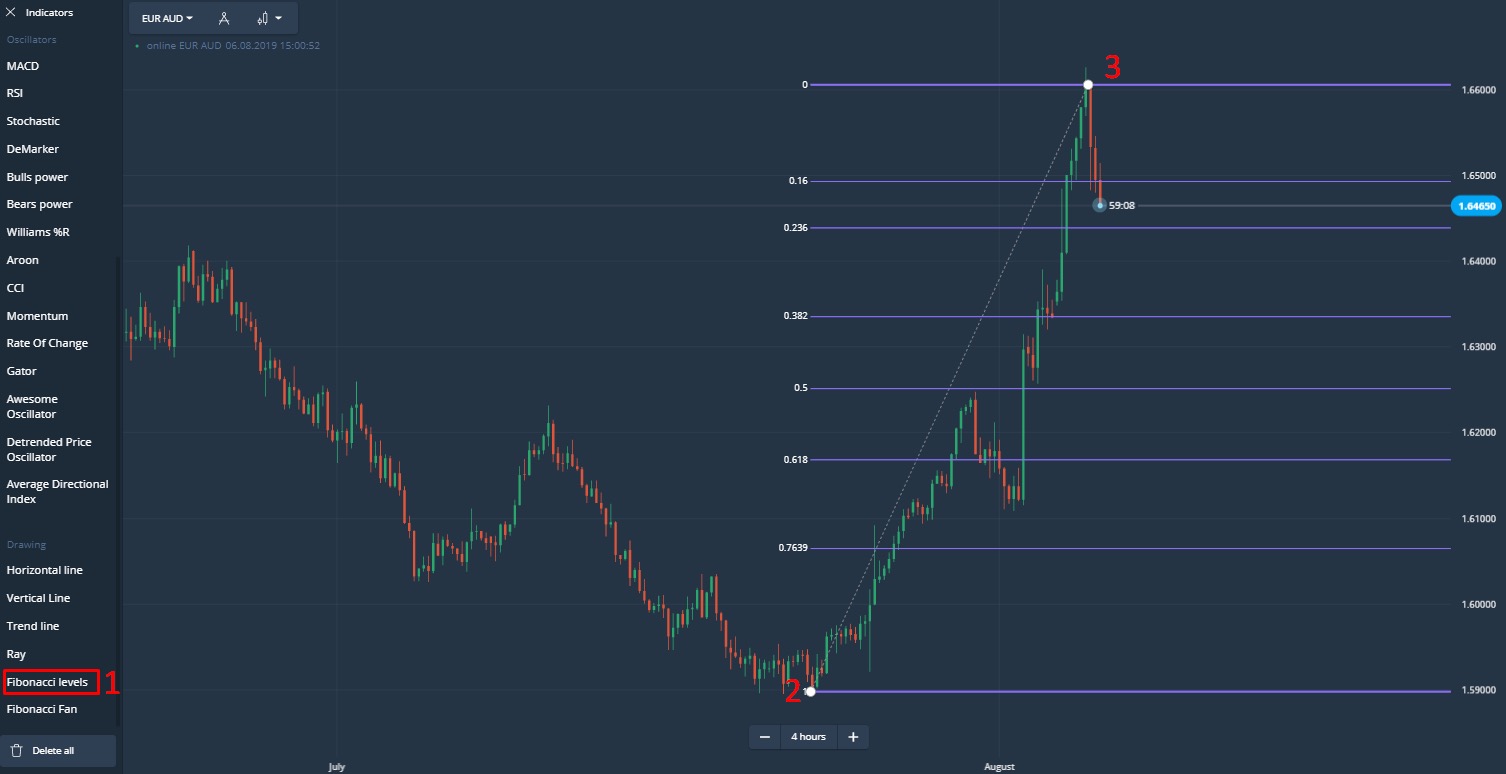
We have connected a random low and high (two squares in the chart) of the EUR/JPY currency pair. This allowed us to assess the impact the levels have on further price behavior (Fig. 1).
In our case, the price either bounced off the levels or accelerated its movement down after a breakout of another Fibonacci level. Thus, in this situation, a trader could get a sufficient number of signals.
Opinion: some traders think that a breakout of the 0.5 level is a reliable signal of a trend reversal.
While Fibonacci levels are a tool that allows you to better navigate a sideways trend, a Fibonacci fan is perfect for trend-following trading.
Register Olymp Trade & Get Free $10,000 Get $10,000 free for newbies
Fibonacci fan
When using it, you get several diagonal rays with different angles of inclination in the chart. As well as the levels, the rays affect the trend: they can halt or activate it.
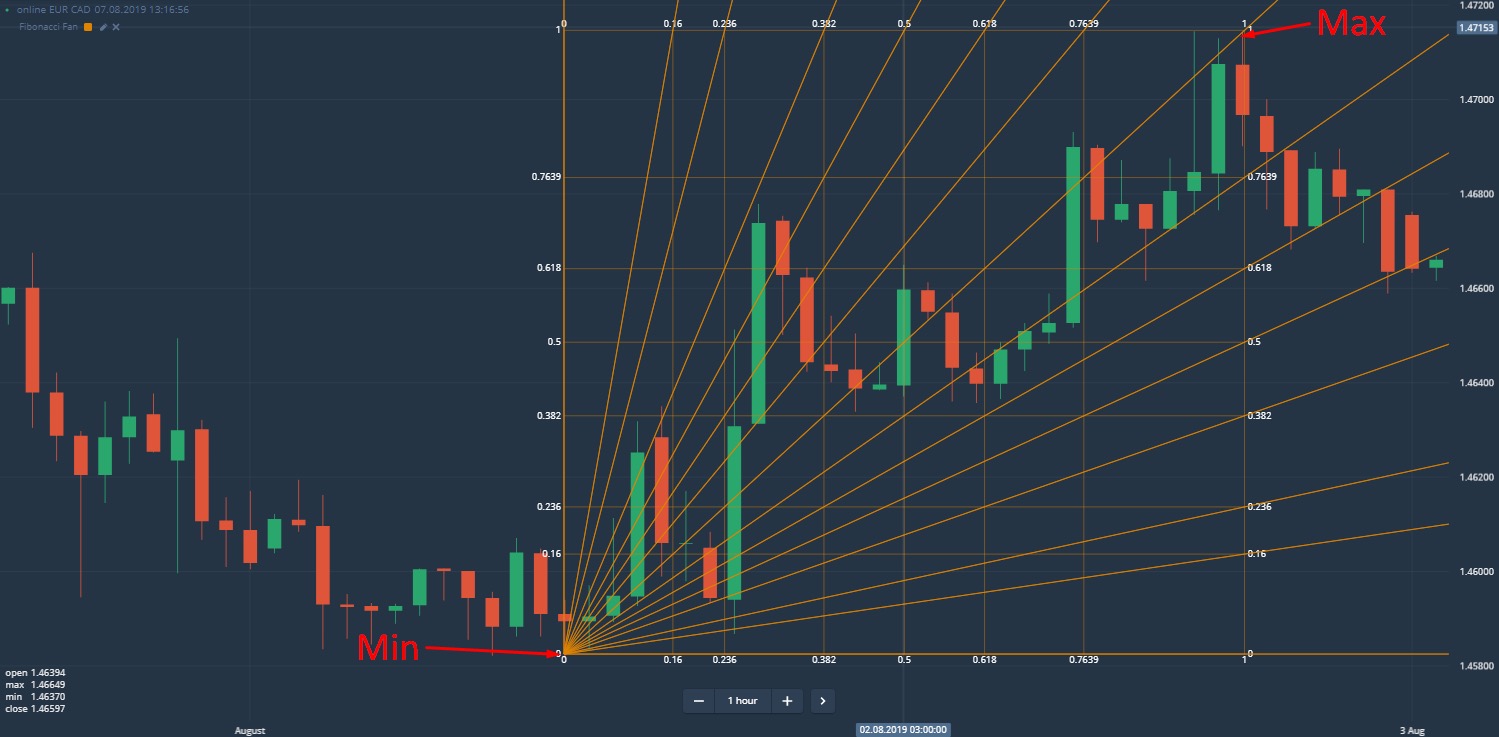
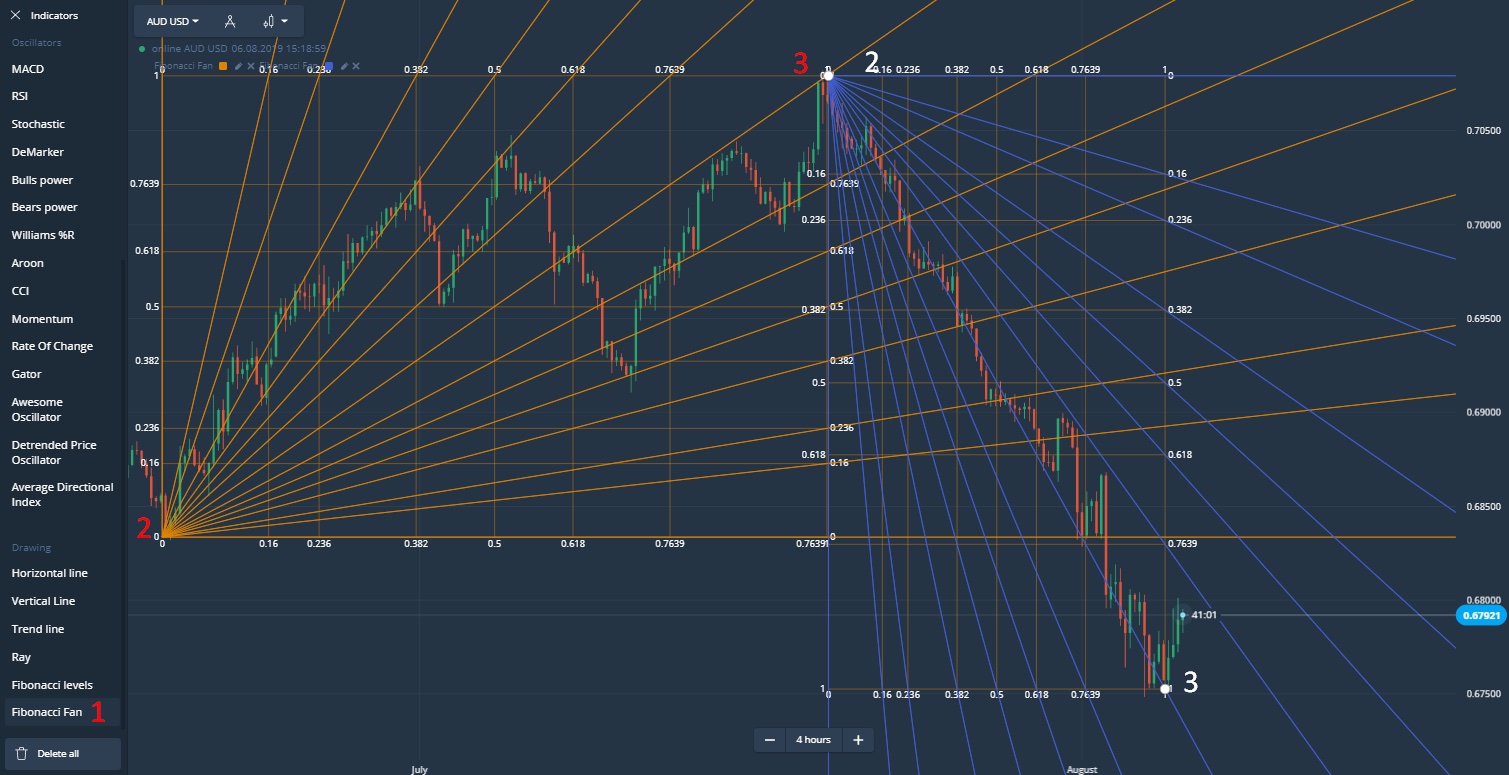
In Fig. 2, we chose random price highs and lows and stretched a Fibonacci fan along with these benchmarks.
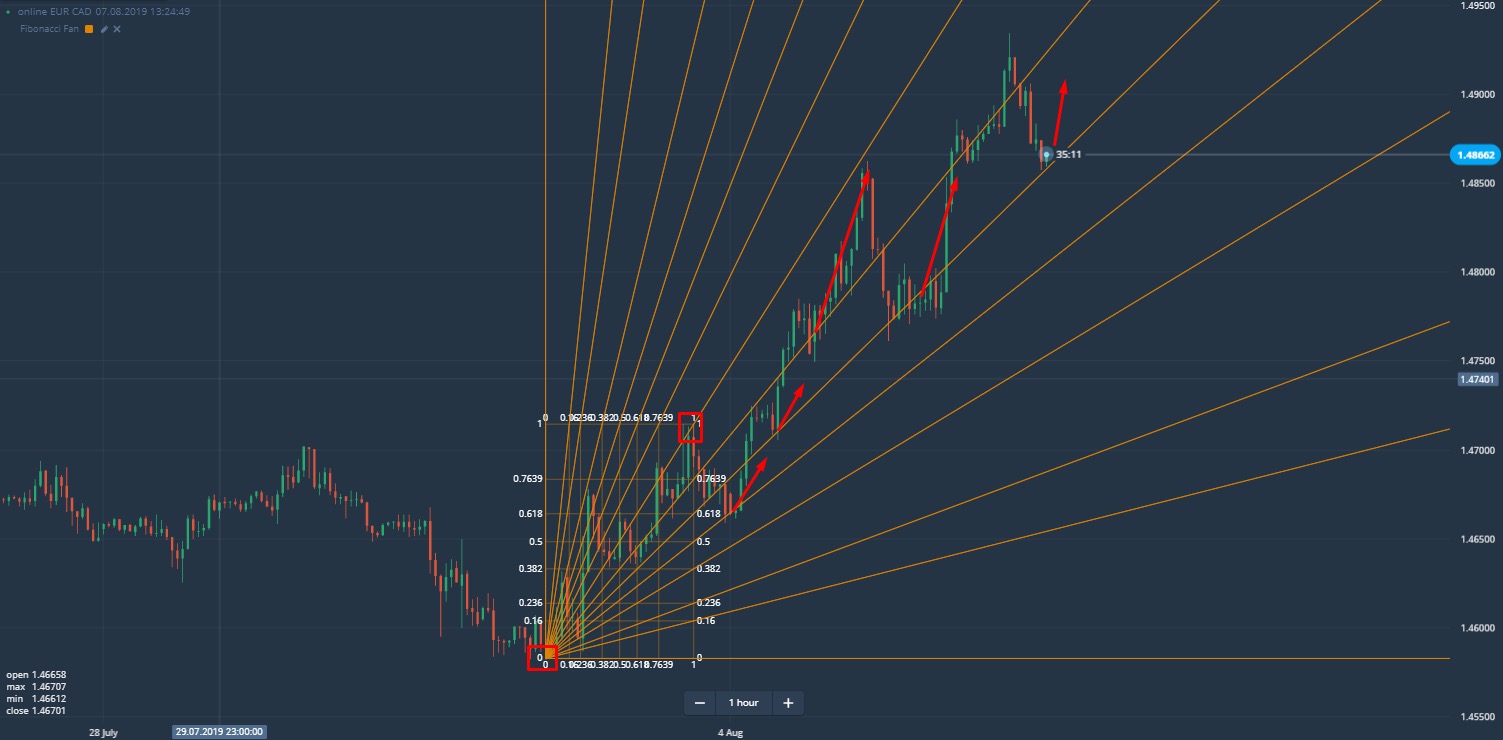
In Fig. 3, you may notice that the Fibonacci Fan’s rays provide a lot of reliable signals to open uptrend-following trades. Note that at the time of making the screenshot, we also had an excellent entry point to a long trade.
How to analyze the chart using Fibonacci?
There is no single approach. There is a quite popular method based on the use of several time frames. When using this method, you place Fibonacci tools on a higher time frame and make only short-term trades.
For example, a trader chose an asset and a 4-hours time frame. He stretched the Fibonacci levels using the last high and low.
Opinion: You can do the same on all the assets before the trading session begins to get more signals in the future.
Then the trader switched to a lower timeframe. This will help him find out:
- The price behavior at some important levels (whethr there was a quick reaction or the market was flat before the activity increased).
- Entry points.Best levels for placing the Stop Loss and Take Profit limiting orders.
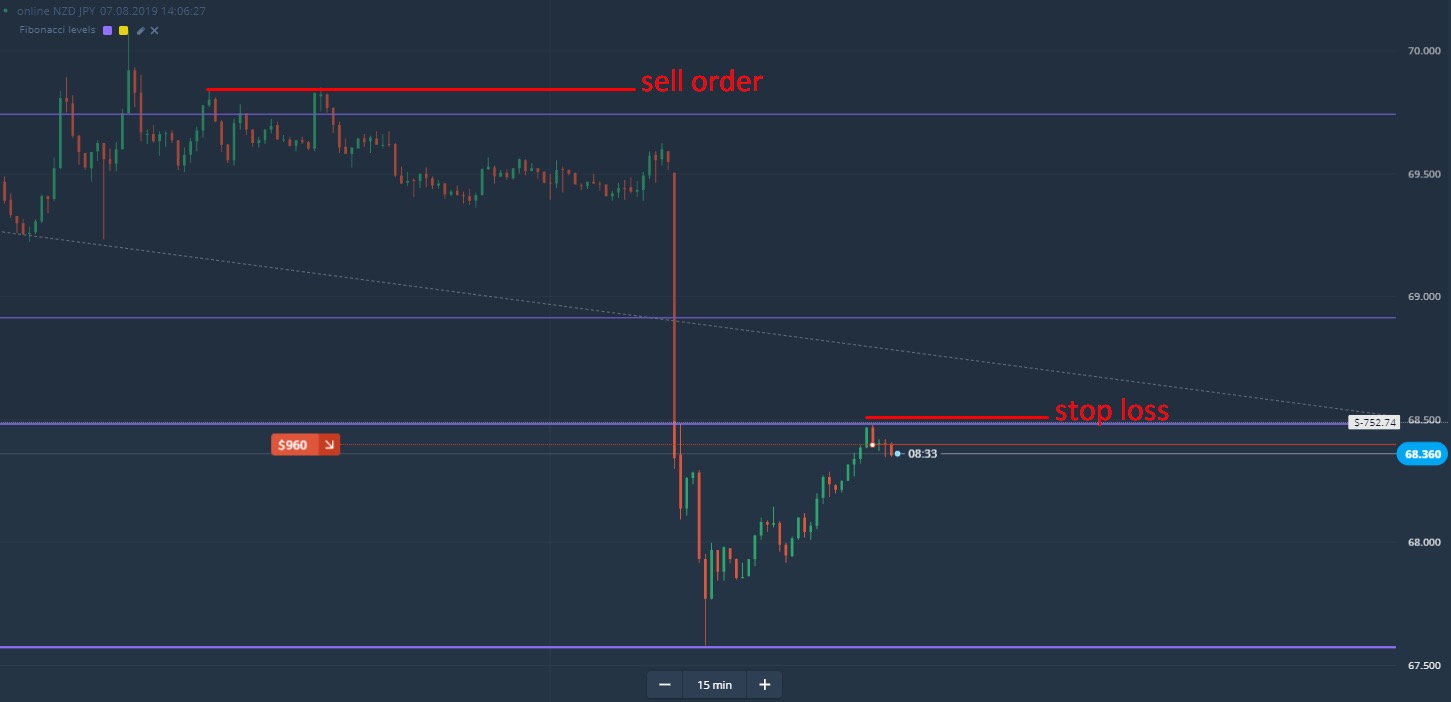
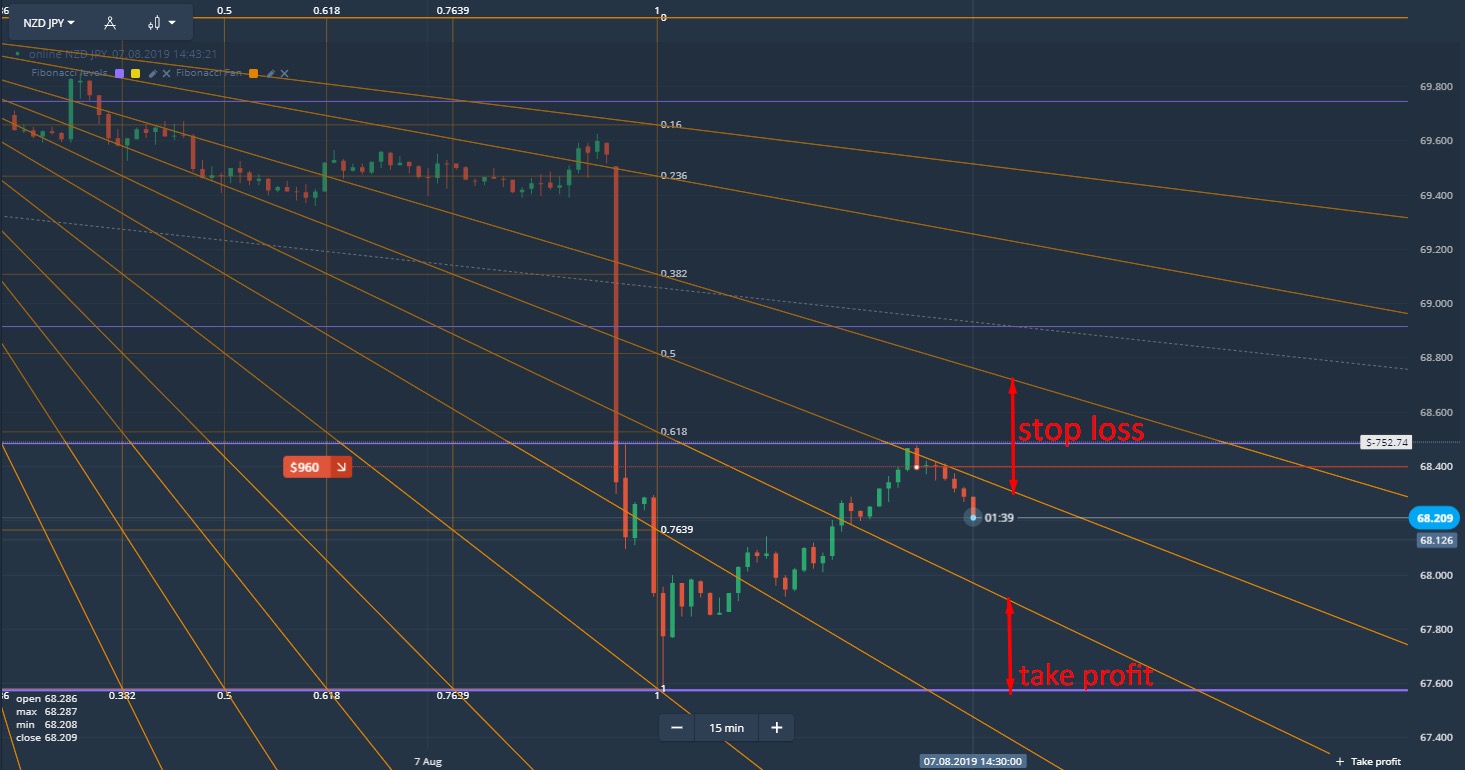
Take a look at Fig. 4:
- This approach allowed us to come up with an excellent investment idea to short the asset using a trade order.
- We could find the optimal level for setting a stop loss for the current short trade.
Fibonacci level, Stop loss and Take profit
Placement of Stop Loss and Take Profit at the right levels is an important element of almost any trading strategy. A simple technical analysis not often provides us with this information but we can use Fibonacci.
You made sure these tools are quite efficient in market analysis. But their contribution to risk management is also beyond question. Here are some tips on how to place Stop Loss and Take Profit based on the above-described tools:
- When going long, set the Stop loss slightly lower than the closest Fibonacci level or the ray located below the current asset price.
- When going short, set the Stop loss slightly higher than the closest Fibonacci level or the ray located above the current asset price.
- Take profit can be set at the nearest level or close to the ray in the direction of your trade.
We can see two reasonable zones for setting Stop Loss and Take Profit in Fig. 5. Note that the levels can provide you with more accurate data but the rays are more flexible.
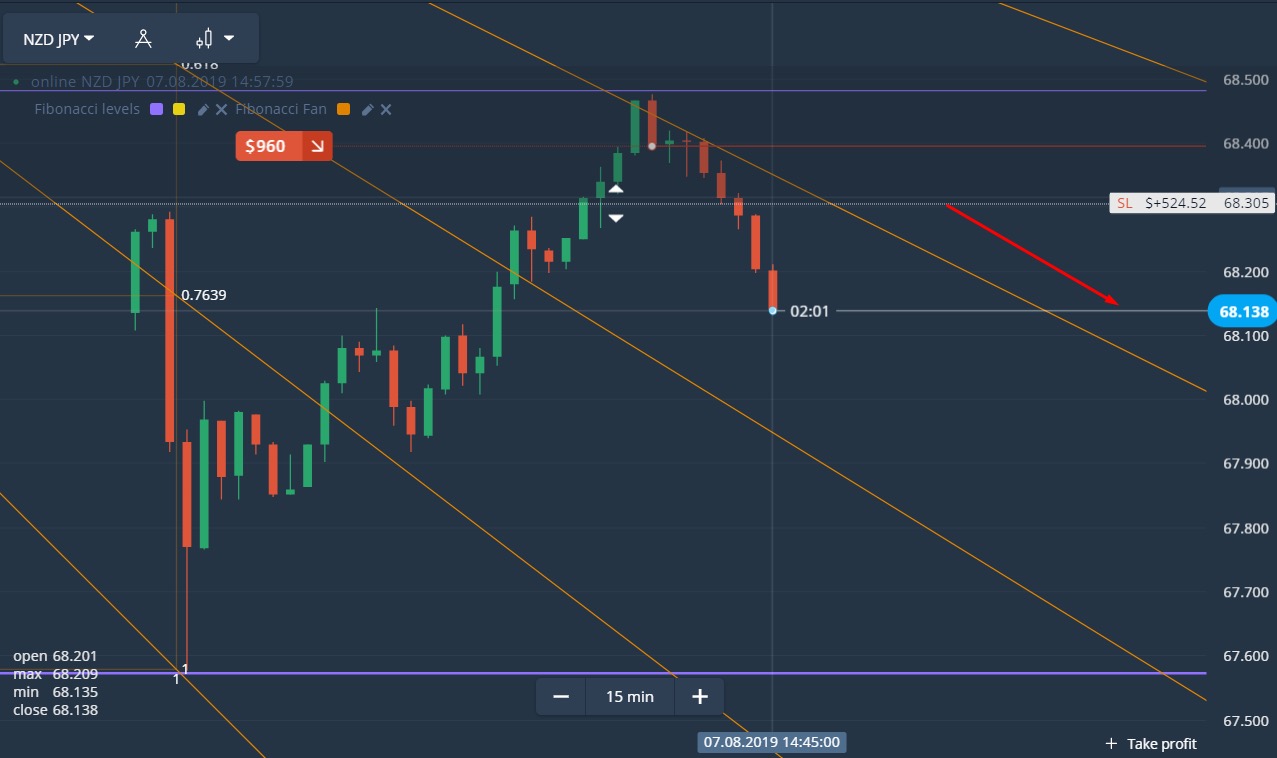
For example, you can constantly move Take profit and Stop Loss due to the slope of the lines. This will allow you to save more profit and reduce risks. You can see in Fig. 6 that the Stop loss had been moved lower but remained above the Fibonacci ray.
What do I combine these tools with?
Fibonacci methods help you predict the trend, determine the targets, and optimize the risks. But each signal can (and sometimes should) be verified by an extra analysis tool:
- Oscillators. If the Fibonacci levels (rays) are giving a buy signal, and the oscillator (for example, the RSI) is in oversold, your chances of making a profitable trade significantly increase.
- Support/resistance levels. Let’s say that the chart went down to the ray of the Fibonacci fan. It is a buy signal. This signal will be confirmed if there is a horizontal support level in the vicinity of the current price.
- Simultaneous use of both the fan and levels. In this case, you should rely on the signals provided by both tools.
Register Olymp Trade & Get Free $10,000 Get $10,000 free for newbies
Which time frames are good for trading Fibonacci?
This method can be used with all time frames. Everything on Earth is expected to conform to the golden ratio or balance.
However, experienced intraday traders still prefer to search for entry points using a time frame of at least 5 minutes. For those who hold positions for 2 or more days, the recommended time frame is 4 hours or more.
How do I set Fibonacci tools on the chart?
In conclusion, we would like to tell you more about how to place a Fibonacci fan or levels on a chart. You will find both tools in the Indicators section of the Olymp Trade platform.
Setting the Fibonacci levels (Fig. 7):
- Select Fibonacci levels.
- Left-click the nearest price low.
- If the trend is up, stretch the scale (fan) to the desired price high and left-click again. If the trend is down, click first the high, then the low.
Setting the Fibonacci fan (Fig. 8):
- Select the “Fibonacci Fan” in the Indicators section.
- If the asset price is going up, connect the lowest low and highest high (red fan). If the trend is bearish, first click the high, and then connect it to the low (blue fan).
The first experience of using this method when trading can be difficult, but after you have made your first successful markings, you will see how effective these tools are. And to make training safe, we recommend that you use a free demo account.
![]() English
English ![]() हिन्दी
हिन्दी ![]() Indonesia
Indonesia ![]() Português
Português ![]() Tiếng Việt
Tiếng Việt ![]() العربية
العربية ![]() ไทย
ไทย


")
 General Risk Notification: Transactions offered by Olymp Trade can be executed only by fully competent adults. Transactions with financial instruments offered on Olymp Trade involve substantial risk and trading may be very risky. If you make Transactions with the financial instruments offered on Olymp Trade, you might incur substantial losses or even lose everything in your Account. Before you decide to start Transactions with the financial instruments offered on Olymp Trade, you must review the Service Agreement and Risk Disclosure Information. Olymp Trade is operated by Saledo Global LLC; Registration number: 227 LLC 2019; Registered Office Address: First Floor, First St. Vincent Bank Ltd Building, P. O Box 1574, James Street, Kingstown, St. Vincent & the Grenadines.