
Chart analysis using the Fibonacci Levels indicator always has a certain ratio. That’s why the purpose of this article is to explain how to increase prediction rates thanks to Fibonacci and the Gartley harmonic patterns, also known as the Crab pattern. This approach is also known as Crab Pattern rules. Let’s go!
Fibonacci Ratios are Key to Crab Patterns
Fibonacci levels are widely used in trading. First of all, Fibonacci levels can be used to identify support levels. They can also be used in wave analysis.
Register Olymp Trade & Get Free $10,000 Get $10,000 free for newbies
Time R.N. Elliott developed his theory, N.M. Gartley published the book “Profits in the Stock Market”. Gartley suggests using Fibonacci ratios to find patterns that will help understand where prices are headed. In this book, The Crab Pattern is the most famous. Let’s see.
Building Crab Patterns
How Do You Build a Bearish Crab Pattern?
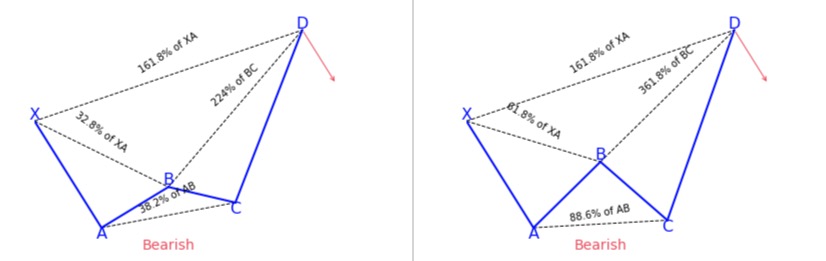
The diagram above indicates the price moving according to the rules like a crab. As you can see, it creates four steps or waves, which eventually form a Double Bottom pattern.
- XA reflects the first price drop.
- AB is a correction from 38.2% to 61.8% of the Fibonacci that follows.
- BC is the second price drop. Frequently, it is quite deep and may reach 88.6% of AB. Sometimes, the fall is not very strong and reaches 38.2%.
- CD is the growth phase that comes next. It may span from 261.8% to 361.8% of BC and 161.8% of XA.
This pattern can be used on any time frame. Let’s take the American Tower Corporation stock price chart as an example of how this works.
Register Olymp Trade & Get Free $10,000 Get $10,000 free for newbies
Bearish Crab Pattern Use Example
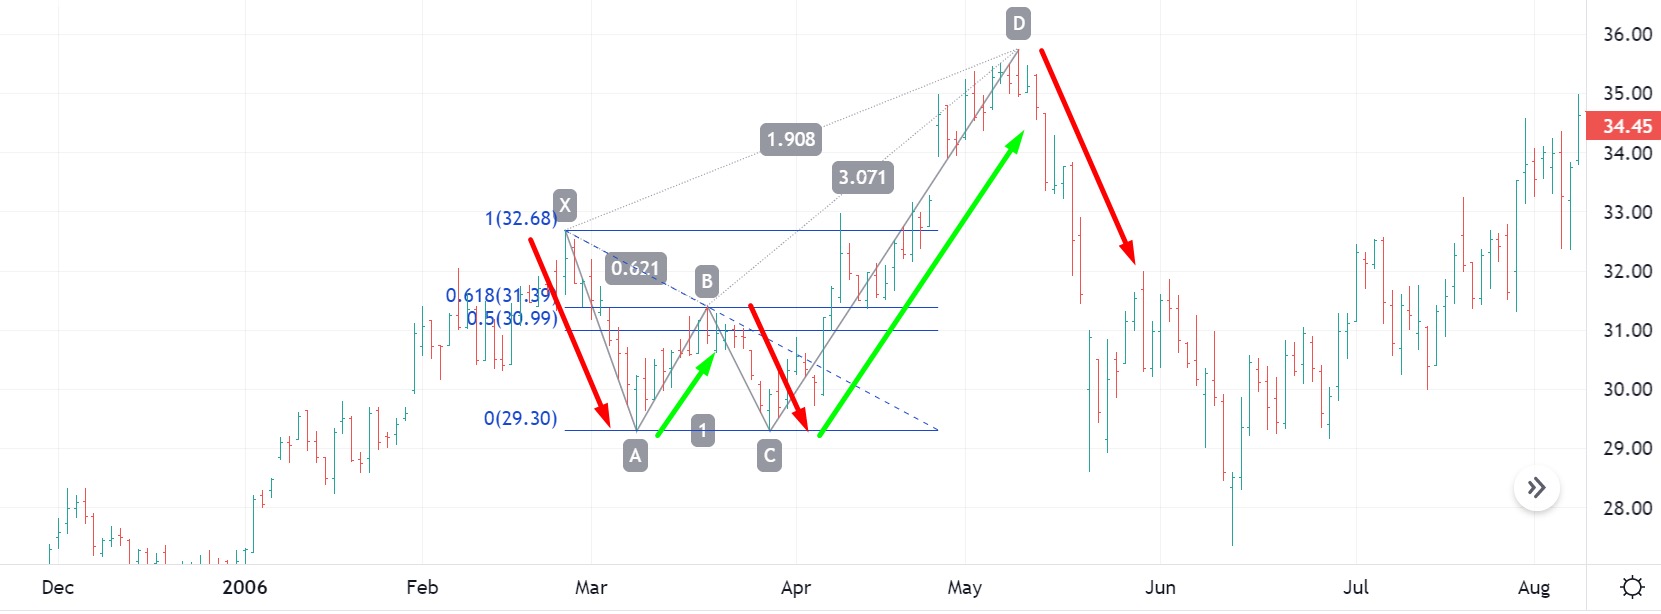
- From the start, the stock downwards from $32.68 to $29.3. That is XA.
- Then it regains up to $31.40. It shows approximately 61.8% of the Fibonacci retracement level. Therefore, it corresponds to the AB upward correction.
- After that, the price rapidly drops again. Leaving the level of $29.30. That corresponds to BC. In this particular case, BC is not 88.6% of AB. Instead, AB and BC are equal.
- CD is formed which shows a sign of upward. It is just over 161.8% of XA and falls short of 361.8% of BC. After that, a strong downtrend forms.
How Do You Build a Bullish Crab Pattern?
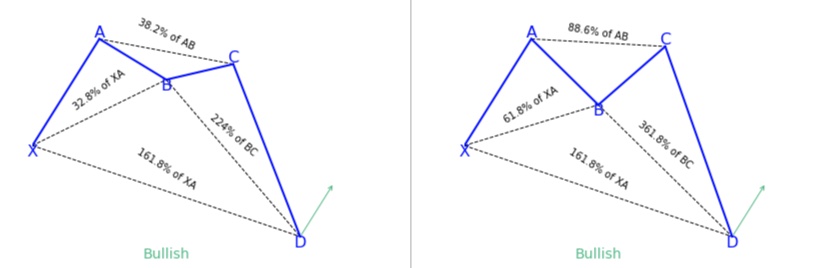
Now, we will have the opposite case with the Bearish Crab pattern. Hence, we will have four steps or waves made by the candles forming a Double Top pattern. The ratio between each price step is the same.
- Firstly, XA reflects the first price rise.
- AB is a correction from 38.2% to 61.8% of the Fibonacci that follows.
- BC is the second price rise. Frequently, it is steep and may reach 88.6% of AB.
- Sometimes, the rise is not very strong and reaches 38.2%.
- CD is the downward phase that comes next. It may span from 261.8% to 361.8% of BC and 161.8% of XA.
- Let’s see how it works with the example of the Apple stock price and try to understand where the end of the last wave will be.
Bullish Crab Pattern Use Example
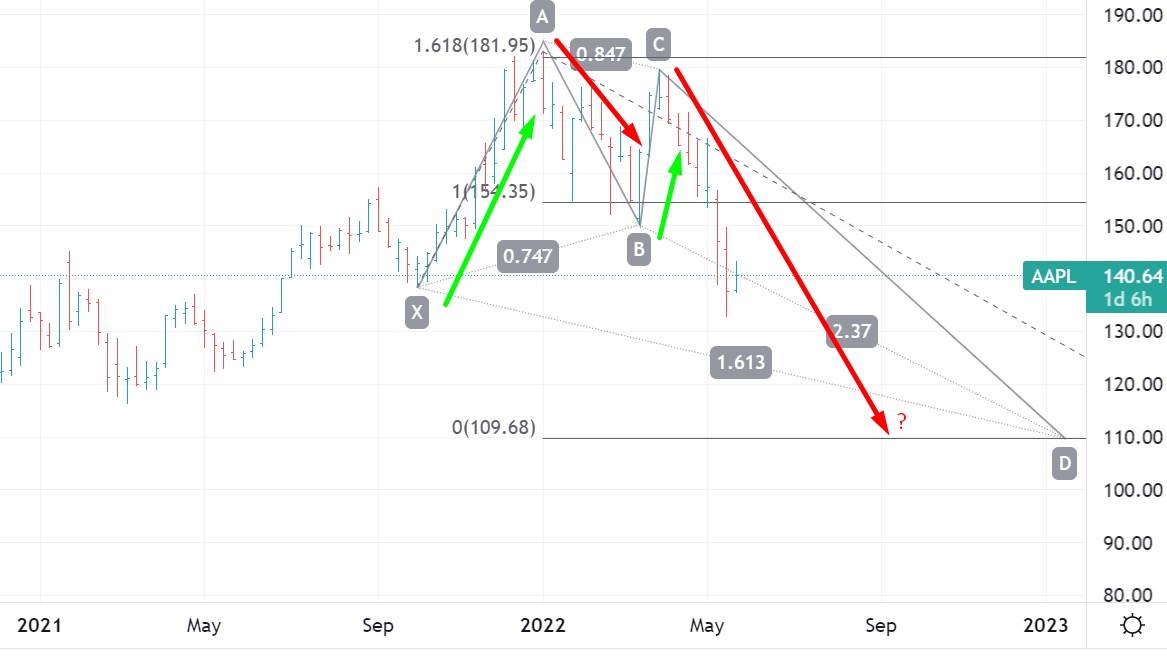
- The rise from the $138.27 level to $182.94 may be taken as XA.
- The following downward AB movement ends at $150.10, which is just over 61.8% of XA.
- The second BC growth phase takes the price up to the level of $179.61.
- Once the second top has formed, the price goes down again. That is CD.
- With the Crab pattern rule, our objective is to forecast the target for the CD wave to identify the level where it may end. According to Gartley’s theory, CD will likely span from 224% to 361.8% of BC and 161.8% of XA.
For the CD wave to be equal to 161.8% of XA, the price has to stop at about $109.7 or simply drop below $110. Here is our deep Crab Pattern. After that, we can wait for the price to start rising.
Learn and Practice
As effective as the Crab Pattern rule may be, it requires skills and experience for consistent results. As always, we recommend traders to use it in combination with the other technical tools, abundantly available on the Olymp Trade platform.


")
 General Risk Notification: Transactions offered by Olymp Trade can be executed only by fully competent adults. Transactions with financial instruments offered on Olymp Trade involve substantial risk and trading may be very risky. If you make Transactions with the financial instruments offered on Olymp Trade, you might incur substantial losses or even lose everything in your Account. Before you decide to start Transactions with the financial instruments offered on Olymp Trade, you must review the Service Agreement and Risk Disclosure Information. Olymp Trade is operated by Saledo Global LLC; Registration number: 227 LLC 2019; Registered Office Address: First Floor, First St. Vincent Bank Ltd Building, P. O Box 1574, James Street, Kingstown, St. Vincent & the Grenadines.