
![]() English
English ![]() हिन्दी
हिन्दी ![]() Indonesia
Indonesia ![]() Tiếng Việt
Tiếng Việt ![]() العربية
العربية
What is the Heiken Ashi candlestick chart?
Heiken Ashi in Japanese means “Average Bar” – The average price bar. It is very good at data analyzing without variable power. Developed from the Basic Japanese Candlestick chart, Heiken Ashi’s high, low, opening, and closing prices are all adjusted through the average formula. The object of applying the formula is Japanese candlesticks charts. Specifically, the formulas are as follows:
-
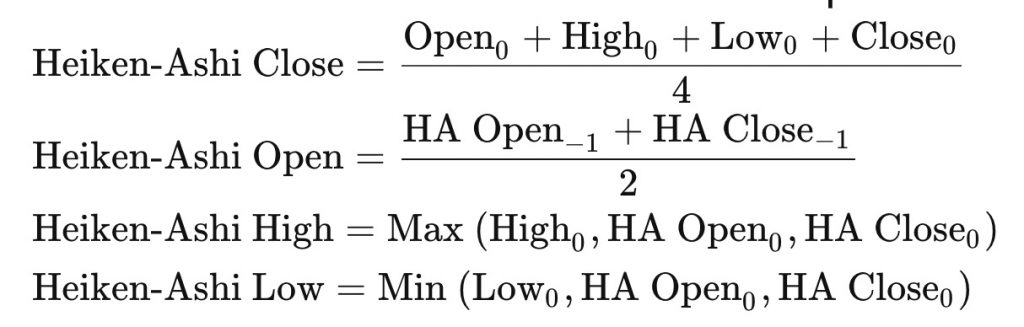
Recipe for calculating Heiken Ashi candles Where:
- Close: The closing price of the Japanese candle
- Open: The opening price of the Japanese candle
- High: The high price of the Japanese candle
- Close: Japanese candle bottom price
- HA Open: Heiken Ashi candlestick opening price
- HA Close: Heiken Ashi candlestick close price
- 0: Current session
- -1: The previous session
- Max: The highest price among the options
- Min: The lowest price among the options
Register Olymp Trade & Get Free $10,000 Get $10,000 free for newbies
What are the benefits of Heiken Ashi candles?
Trend identification is easy
Heiken Ashi candlestick chart makes it easy to identify price trends. A UP candle without a lower shadow shows a strong uptrend, whereas a DOWN candle with no upper shadow identifies a strong downtrend. Reverse analysis techniques are still applicable to Heiken Ashi candles without any problems. There will be no gaps in the Heiken Ashi Candlestick Chart because they are created by averaging the information of the previous candle.
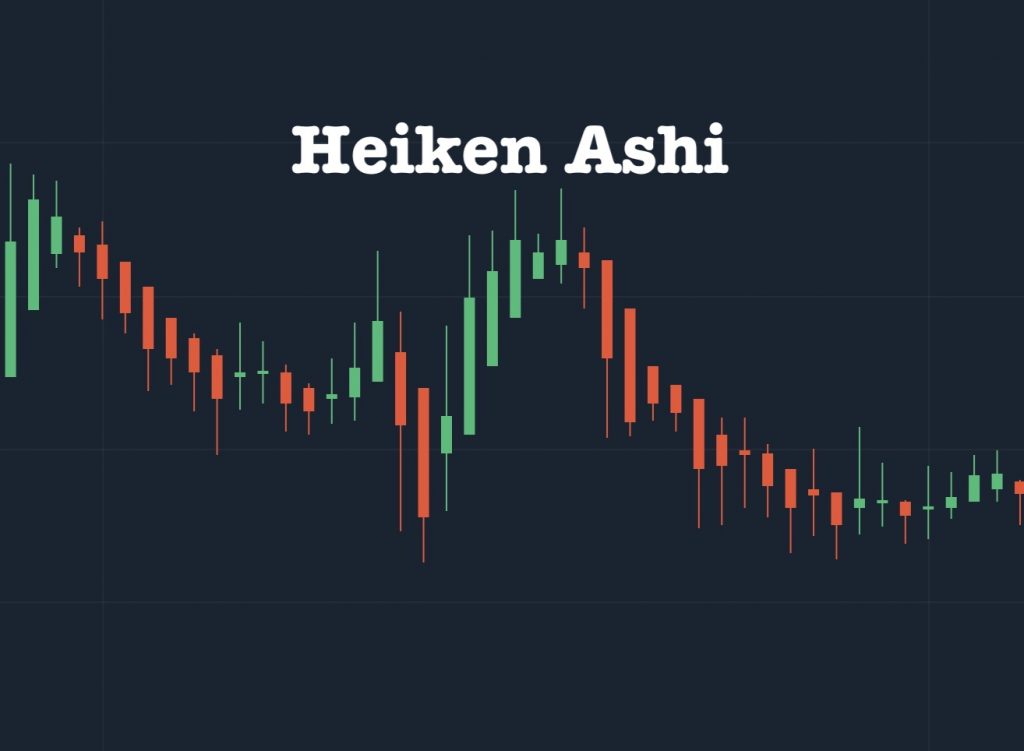
Heiken Ashi candlestick in technical analysis Photo: Olymp Trade Reduce noise
The Heiken Ashi candlestick technique reduces noise signals when the market is in equilibrium with little volatility. Help traders avoid trading in this zone. Especially the noise of Gap, making the price unsuitable for analysis tools. By means of averages, it reduces unnecessary fluctuations, giving information about the mean for easier analysis.
Register Olymp Trade & Get Free $10,000 Get $10,000 free for newbies
Easily track volatility
Because Heiken Ashi candles reduce noise between 2 consecutive candles, you can easily spot trends, reversals, and patterns more easily. Basic Japanese candlestick charts often have empty spaces (GAP), with continuous ups and downs, making them difficult to analyze. Because Heiken Ashi reduces noise resulting in more candles of the same color, it makes it easier to spot short-term fluctuations in the past.
Difference between Heiken Ashi and Renko
The Heiken Ashi chart uses an average formula based on the information of two adjacent candles. Meanwhile, Renko charts only show clearly sized movements. Renko chart has box shapes that are not controlled by time, but only follow up and down movements. About Heiken Ashi, it will form a new candlestick every fixed period, unlike Renko, which only creates a new block when the price has moved a certain amount.
Limitations of Heiken Ashi candlestick chart
Not suitable for Swing
Heiken Ashi technique uses the information of two adjacent sessions for analysis, so it is often used for longer-term trading. They are not suitable for Traders who prefer Swing trading. Even so, Traders still have to make immediate moves even though Heiken Ashi does not have enough timely response. Just trade a little and you will notice it.
Register Olymp Trade & Get Free $10,000 Get $10,000 free for newbies
Missed a lot of information
Average data does not respond to volatility, and sometimes you can miss out on a lot of information so the response is not in time. The closing price per session is valued by many traders, but the actual closing price is not seen on the Heiken Ashi chart.
In order to avoid risk, in fact, the trader must take the actual price in order to Take Profit and Stop Loss in time. Most of the Traders still apply Japanese Candlesticks in parallel with Heiken Ashi Candlesticks.
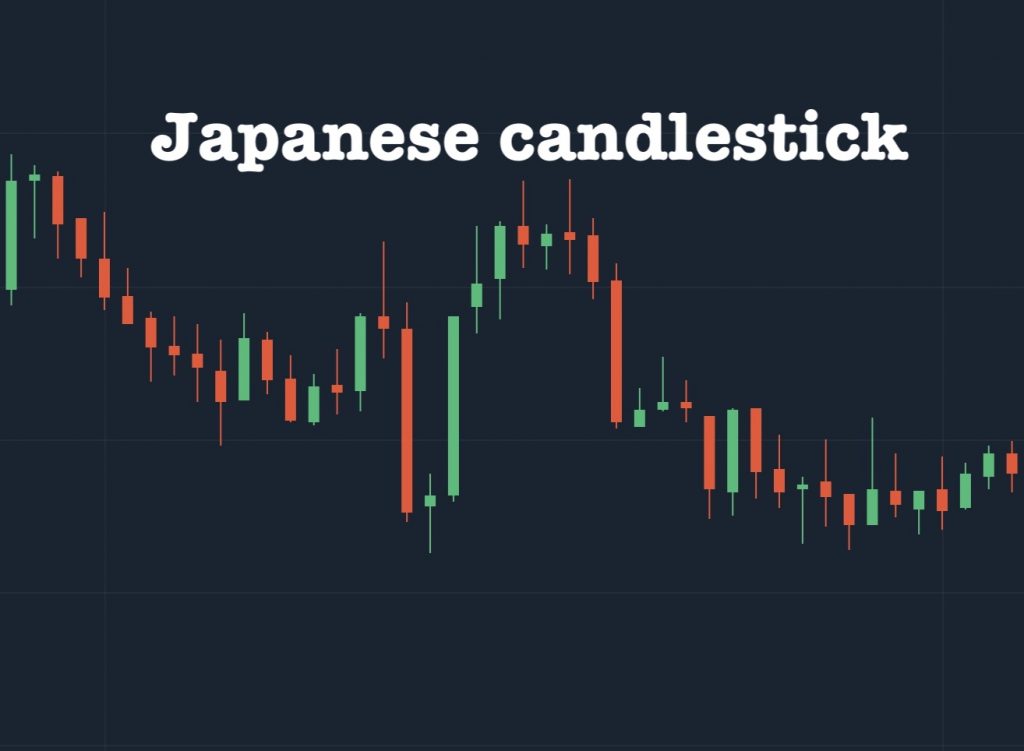
Japanese candlestick chart in technical analysis Photo: Olymp Trade There is no Gap
For some traders, they use the Gap to analyze momentum, set stop loss, or trigger entries. This is an important factor in technical analysis, so some traders prefer the original data.
 English
  हिन्दी
  Indonesia
  Tiếng Việt
  العربية


")
 General Risk Notification: Transactions offered by Olymp Trade can be executed only by fully competent adults. Transactions with financial instruments offered on Olymp Trade involve substantial risk and trading may be very risky. If you make Transactions with the financial instruments offered on Olymp Trade, you might incur substantial losses or even lose everything in your Account. Before you decide to start Transactions with the financial instruments offered on Olymp Trade, you must review the Service Agreement and Risk Disclosure Information. Olymp Trade is operated by Saledo Global LLC; Registration number: 227 LLC 2019; Registered Office Address: First Floor, First St. Vincent Bank Ltd Building, P. O Box 1574, James Street, Kingstown, St. Vincent & the Grenadines.