
Fibonacci was an Italian mathematician who examined a specific number sequence. That sequence, considered to have correspondence to the “golden ratio” and observed in many spheres of nature, has eventually found many practical applications. Trading is one of them, and this article shows how you can use Fibonacci indicators as a technical analysis tool.
Fibonacci Levels Indicator
What are Fibonacci Levels?
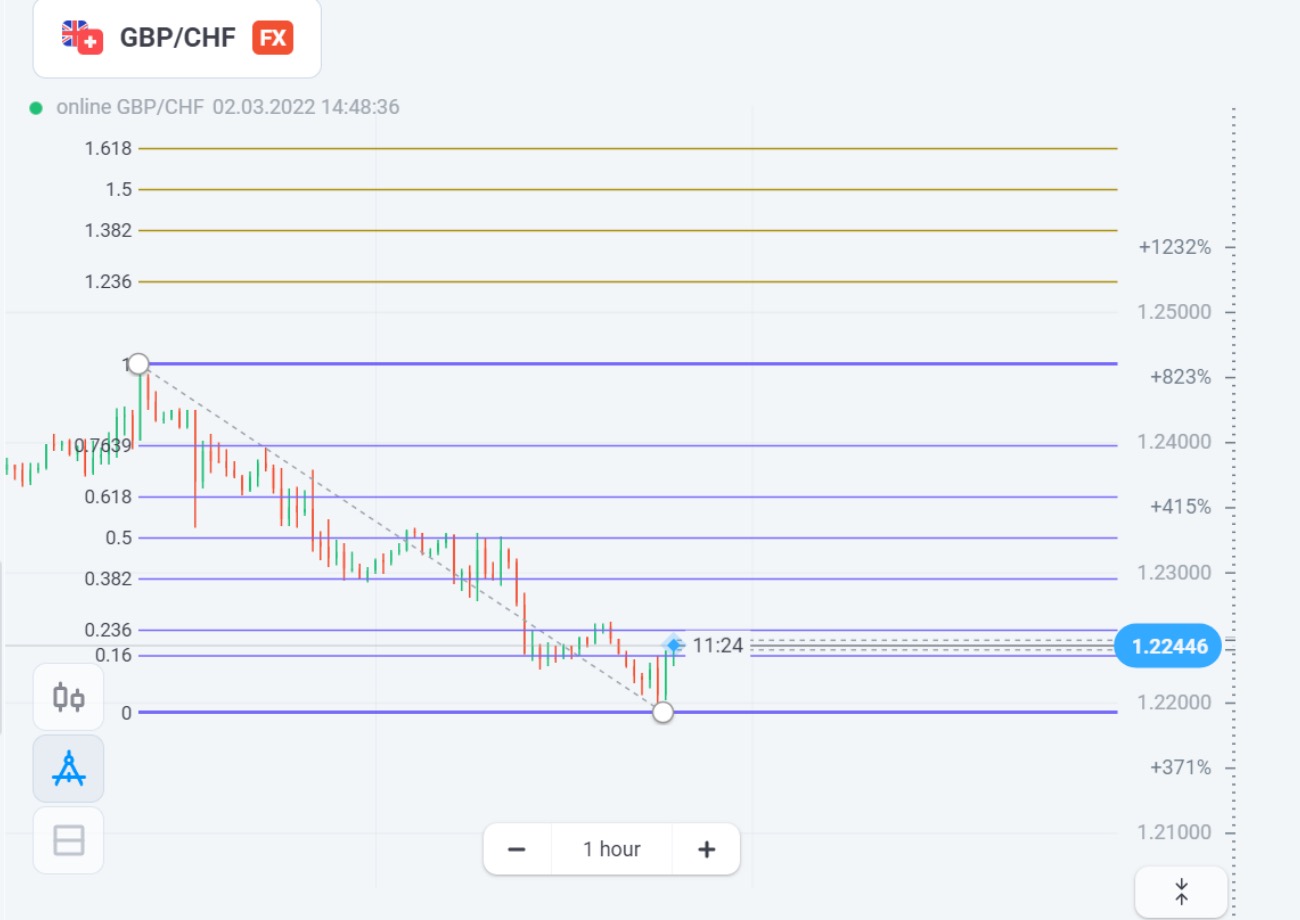
Fibonacci Levels is avaiable on Olymp Trade platform. Basically, it is presented by an array of parallel horizontal lines at different distances.
Register Olymp Trade & Get Free $10,000 Get $10,000 free for newbies
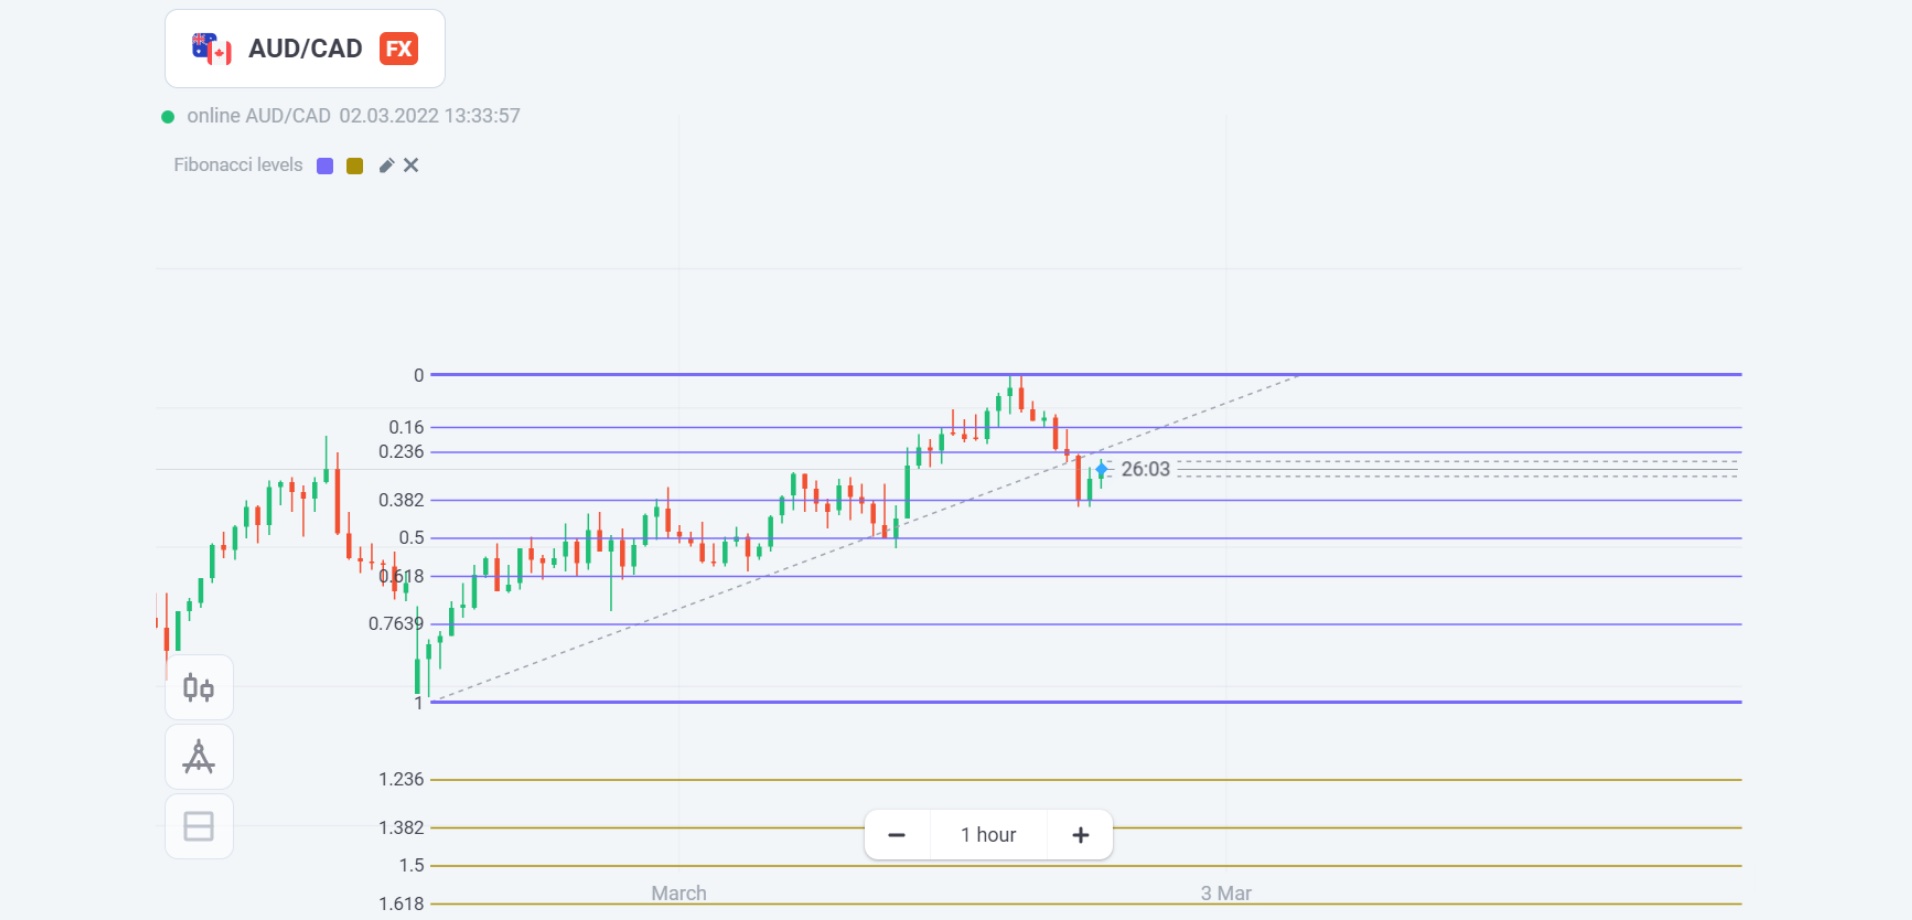
The green diagonal that crosses the entire indicator’s area should coincide with the direction of the trend you are applying it to.
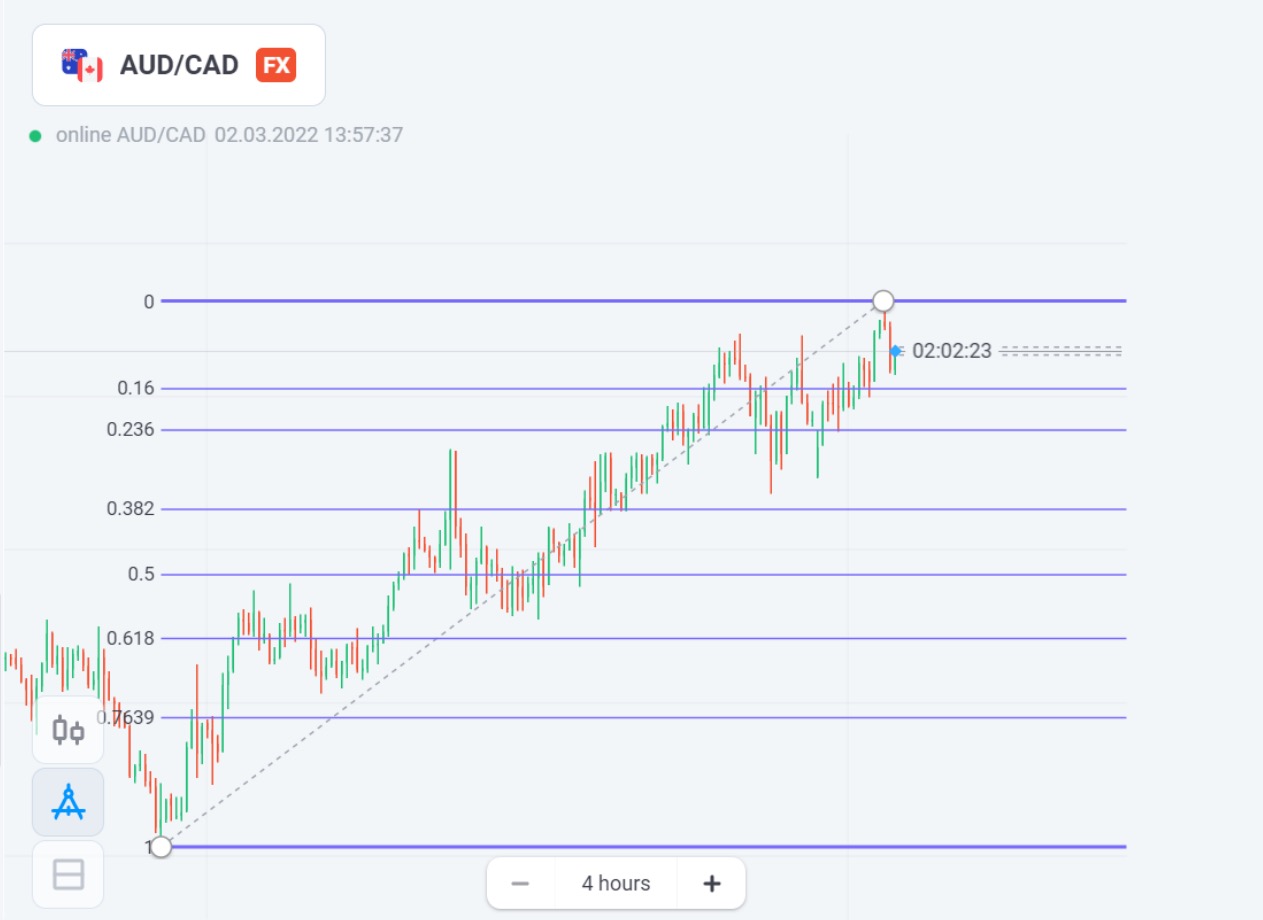
With a downtrend, match the top-left corner of the indicator with the high and the bottom-right corner with the low.
Meaning of Fibonacci Levels
The lines of the Fibonacci Levels present levels where the price may reverse or accelerate.
Register Olymp Trade & Get Free $10,000 Get $10,000 free for newbies
The baseline of the Fibonacci Level corresponds to 0% as it is the starting point of the indicator’s charting. The upside of the indicator is the 100% level. Between these two, there are inner lines. Their percentages reflect their position on the way from 0% to 100% of the Fibonacci Levels and serve to distinguish them from each other.
In application to price forecasting, each of the inner lines may either be an important level or an auxiliary level.
If it’s an important level, then it is expected to produce a signal of higher reliability than that of the auxiliary. Here is the table that reflects where each line stands in terms of this distinction.
| Level | Importance |
|---|---|
| 1 (or 100%) | the endpoint of calculations |
| 0.618 (or 61.8%) | an important level |
| 0.5 (or 50%) | an important level |
| 0.382 (or 38.2%) | an auxiliary level |
| 0.236 (or 23.6%) | an auxiliary level |
| 0 (0%) | the starting point of calculations |
Generally, breaking out of the 0.5 level is considered as one of the most reliable signals for trend reversal. Similar logic may be applied to other important levels.
Fibonacci Fan Indicator
The Fibonacci Fan indicator appears as a set of rays that all start at the bottom-left point and expand to the right at various angles.
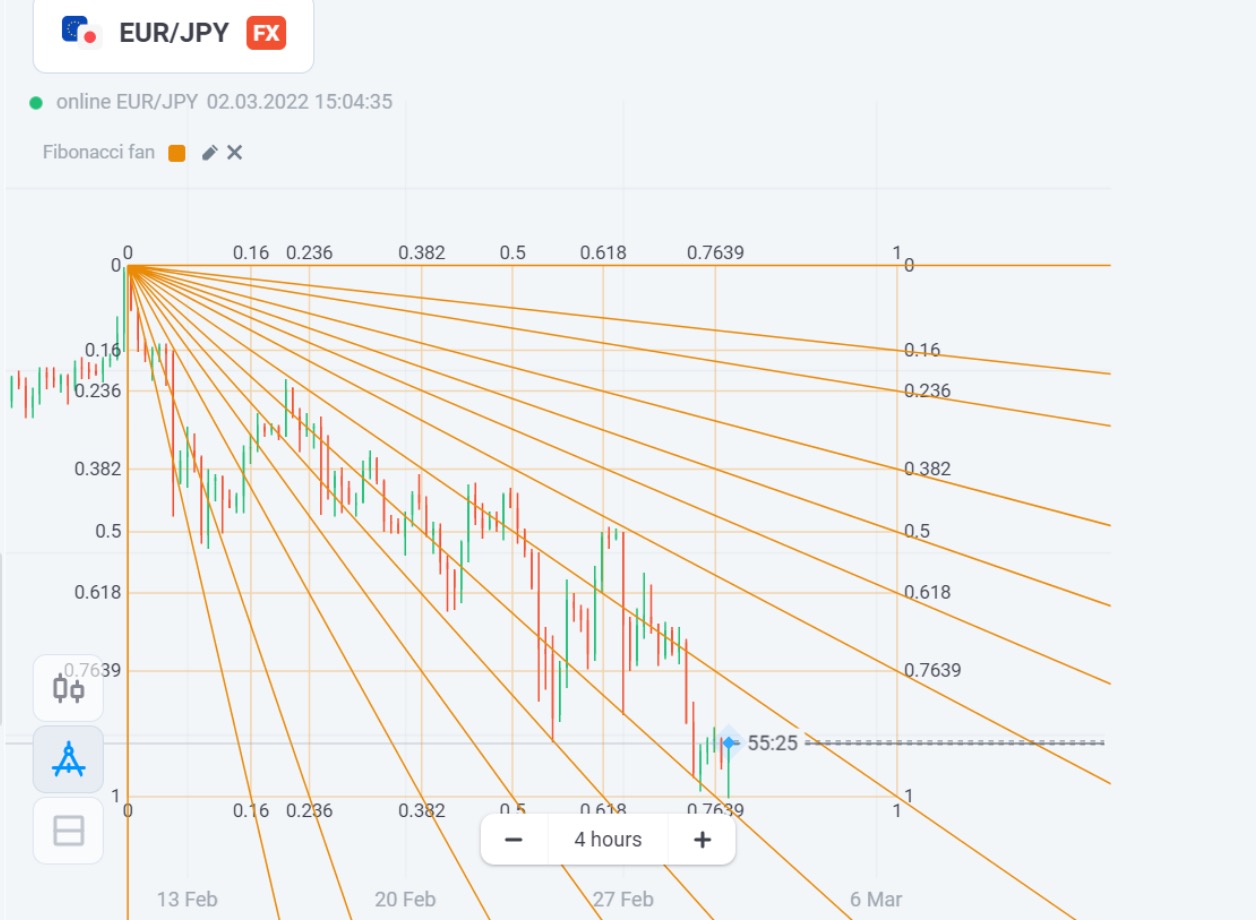
Similar to the Fibonacci Levels indicator, once you chart it on the screen, you can move it around by dragging the starting point and the upper ray that defines the span of the indicator. The rays are automatically reconfigured as you adjust the indicator up to your requirements.
Which Time Frames are Best for Using Fibonacci Indicators?
While technically any time frame is suitable for the Fibonacci indicators, experienced traders often prefer the 5m time frame for intraday trading and a 4h time frame for long-term positions.
Register Olymp Trade & Get Free $10,000 Get $10,000 free for newbies
What Can I Combine with Fibonacci?
Here are the tools that you can use together with the Fibonacci indicators to maximize the overall efficiency of forecasting trends, find optimal market entry points, and reduce risks.
- Oscillators: If the Fibonacci Levels or rays are giving a buy signal, it may be confirmed by an oscillator such as RSI if it is in the oversold zone.
- Support/Resistance Levels: Very often, if the price goes below the ray of the Fibonacci fan, it is a buy signal. This signal may be double-confirmed if there is a horizontal support level in the vicinity of the current price.
Both scenarios presented above may be applied together in combination with Fibonacci indicators.


")
 General Risk Notification: Transactions offered by Olymp Trade can be executed only by fully competent adults. Transactions with financial instruments offered on Olymp Trade involve substantial risk and trading may be very risky. If you make Transactions with the financial instruments offered on Olymp Trade, you might incur substantial losses or even lose everything in your Account. Before you decide to start Transactions with the financial instruments offered on Olymp Trade, you must review the Service Agreement and Risk Disclosure Information. Olymp Trade is operated by Saledo Global LLC; Registration number: 227 LLC 2019; Registered Office Address: First Floor, First St. Vincent Bank Ltd Building, P. O Box 1574, James Street, Kingstown, St. Vincent & the Grenadines.