
![]() English
English ![]() हिन्दी
हिन्दी ![]() Indonesia
Indonesia ![]() Tiếng Việt
Tiếng Việt ![]() العربية
العربية
The Trendline indicator is an extremely simple analytical indicator. However, if you do not read through the concept of Trendline, you are probably using this indicator the wrong way. This article will guide you on how to grasp the signals of the trendline.
Register Olymp Trade & Get Free $10,000 Get $10,000 free for newbies
*This article uses Trendline illustrations from the Olymp Trade broker.
Trendline definition
What is the Trendline indicator?
A Trendline is a combination of many peaks and bottoms to create a clear up or down trend line. It forms a common pattern of the trend, from which we will choose the appropriate signal to make a trade.
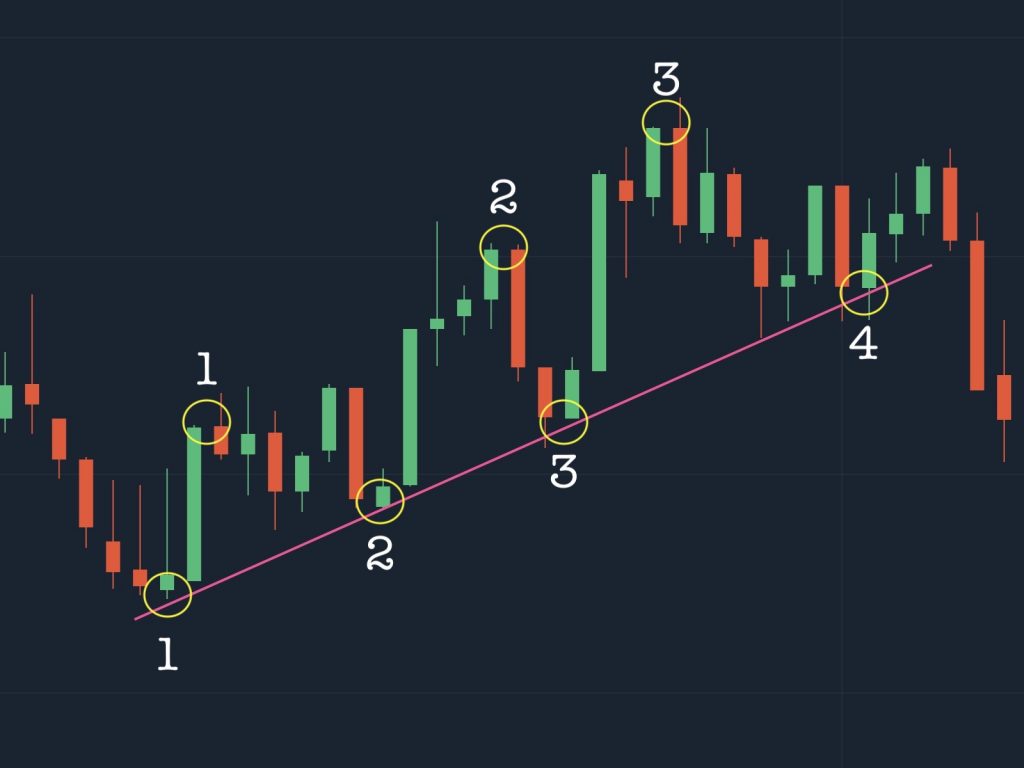
Uptrend Trendline indicator
Trendlines for an uptrend has the following characteristics:
- Starting from a reversal point from a downtrend to an uptrend, new bottoms will appear. The line connecting two adjacent bottoms will create a Trendline.
- Two near bottoms have the last higher than the previous one. If the lower bottom is lower than the previous one, the trend line cannot be drawn at this time.
- The time to draw the Trendline is when two consecutive vertices appear and the second peak must be higher. These consecutive peaks must appear after the beginning of the first bottom.
- The best slope of the Trendline is above 20 degrees and less than 45 degrees.
Register Olymp Trade & Get Free $10,000 Get $10,000 free for newbies
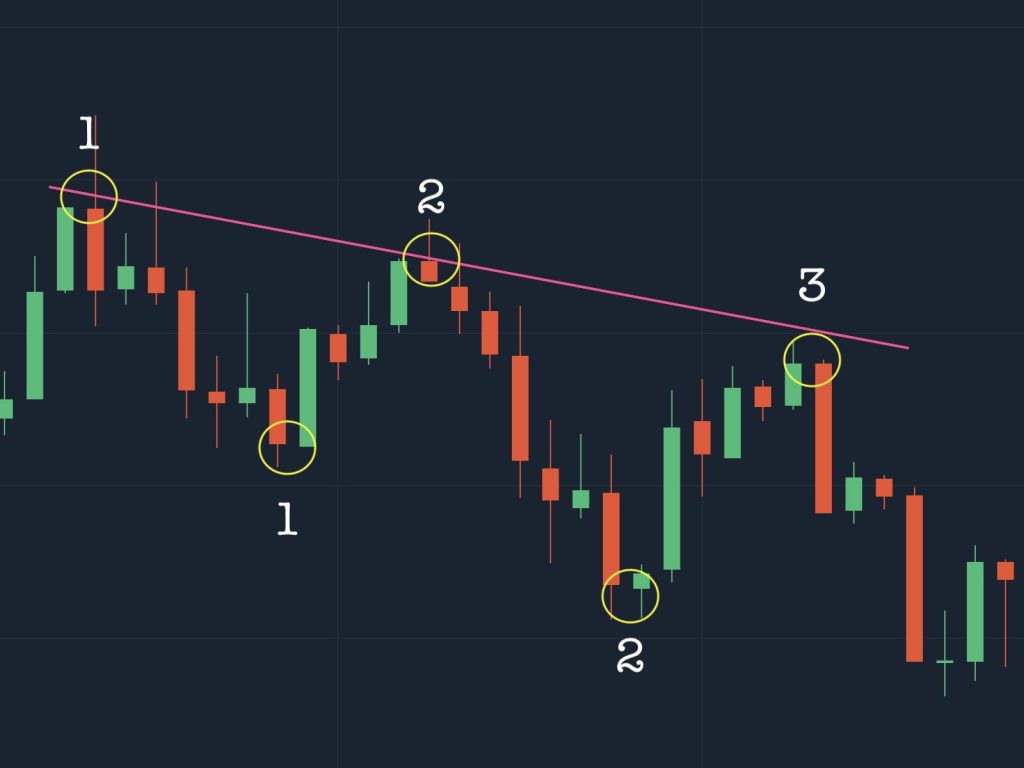
Downtrend Trendline indicator
Conversely, we will draw a Trendline of a downtrend once we see the following signals:
- After a reversal from bullish to bearish, the peaks will appear in turn. Connecting two adjacent vertices will create a trendline.
- The next peak must be lower than the previous one. Otherwise, we will not be able to draw a downtrend trendline because the trend is not clear.
- We draw a line connecting two adjacent vertices once the second bottom is smaller than the first. The bottoms should appear after the beginning of the first peak.
- The best slope of the Trendline is still above 20 degrees and less than 45 degrees.
Use Trendline indicator to execute long position
The Trendline indicator is suitable for trading positions longer than 30 minutes with a session time of 5 minutes. This indicator is similar in nature to the Support and Resistance indicator.
Trendline entry signals
For this character of Trendline, you make a trade at the moment the price hits the Trendline after you did draw trendline as below:
- For an uptrend: The price moves close to the Trendline and creates a new bottom higher previous one. You will place an Up / Buy with a duration of 30 minutes.
- For the downtrend: A new peak will be created near the Trendline, it is time to set it to Down / Sell within 30 minutes.
![]() English
English ![]() हिन्दी
हिन्दी ![]() Indonesia
Indonesia ![]() Tiếng Việt
Tiếng Việt ![]() العربية
العربية


")
 General Risk Notification: Transactions offered by Olymp Trade can be executed only by fully competent adults. Transactions with financial instruments offered on Olymp Trade involve substantial risk and trading may be very risky. If you make Transactions with the financial instruments offered on Olymp Trade, you might incur substantial losses or even lose everything in your Account. Before you decide to start Transactions with the financial instruments offered on Olymp Trade, you must review the Service Agreement and Risk Disclosure Information. Olymp Trade is operated by Saledo Global LLC; Registration number: 227 LLC 2019; Registered Office Address: First Floor, First St. Vincent Bank Ltd Building, P. O Box 1574, James Street, Kingstown, St. Vincent & the Grenadines.