
![]() English
English ![]() हिन्दी
हिन्दी ![]() Indonesia
Indonesia ![]() Português
Português ![]() Tiếng Việt
Tiếng Việt ![]() العربية
العربية ![]() ไทย
ไทย
How to Use Trend, Horizontal, Vertical lines, and More On Olymp Trade
Trendlines are extremely versatile trading tools but are often misunderstood or overlooked. They are useful for Forex and Fixed Time Trades. Combining different lines together helps traders capitalize on market trends with better accuracy to increase trading profitability.
Though simple lines, they are often misused, leading traders to make costly decisions. Often used in tandem with support and resistance levels: represented by horizontal lines, to form areas of interest, these lines bring clarity to an asset’s price action.
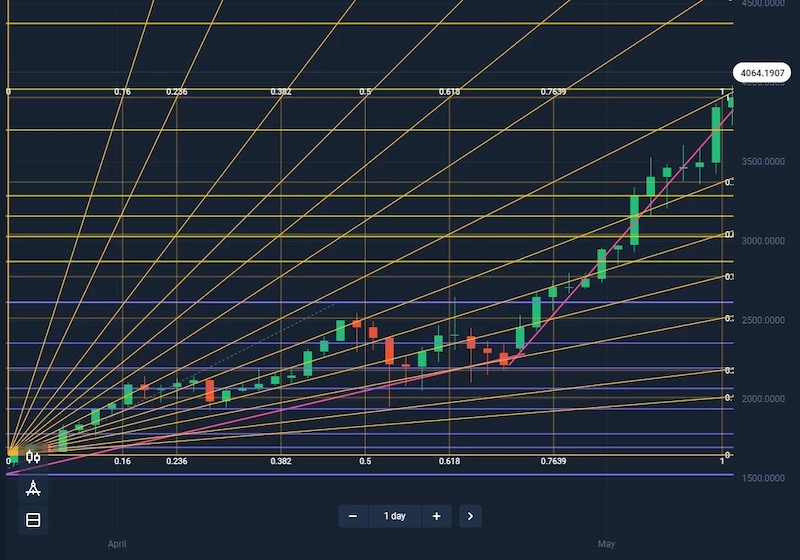
As simple as they are to use, traders often wind up with charts that look like this, covered in so many lines that nothing useful can come of it.
Register Olymp Trade & Get Free $10,000 Get $10,000 free for newbies
What are Trendlines?
Trendlines are essentially sloping Support and Resistance lines. They measure the price movement of an asset in either direction. Technical analysis utilizes trendlines to quickly establish the trend and its strength. There are ultimately two types of trendlines:
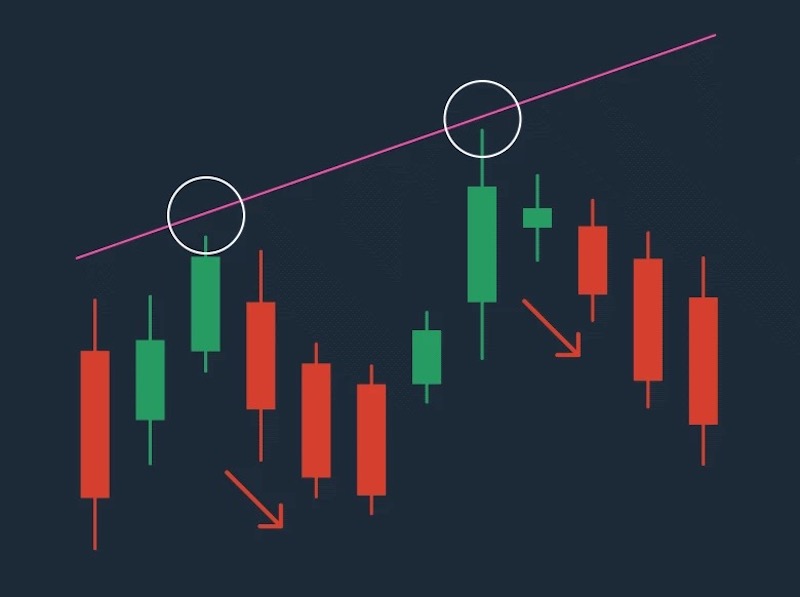
Bullish Trendlines – Upward Sloping Trendline
As prices continue to rise, creating higher highs and higher lows, a bullish trend is formed. Bullish trendlines are set below the price action, acting similarly to an upward sloping support level connecting the lower portion of at least two candles. The line helps define upward buying pressure controlling the market.
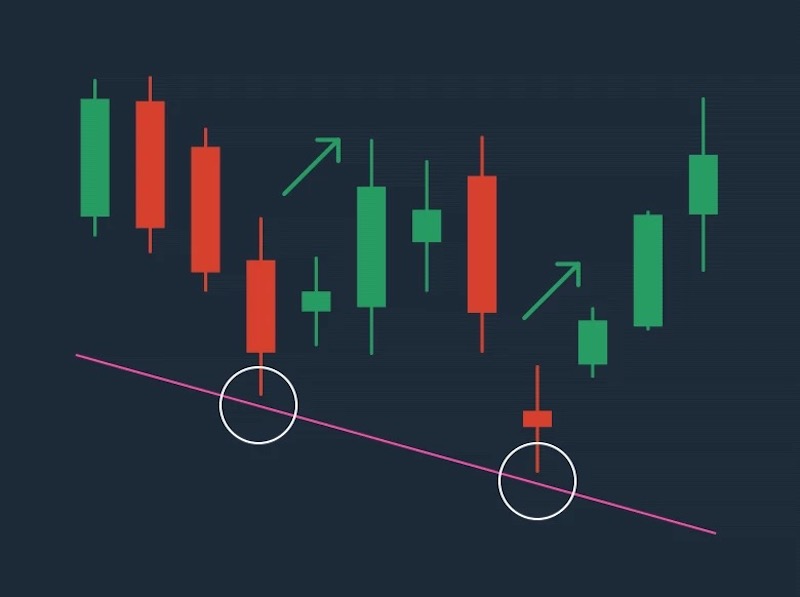
Bearish Trendlines – Downward Sloping Trendline
Prices continue to fall, creating lower highs and lower lows that form a downtrend. Bearish trendlines are set above the price movement, acting almost as a sloping resistance level. Connecting the highs of two candles determines the line’s path. The area this line creates represents downward selling pressure in control of the market.
The more candles that touch either trendline the stronger the trend. When combined with a trading strategy, they can give reliable trading signals.
Register Olymp Trade & Get Free $10,000 Get $10,000 free for newbies
What Are Support & Resistance Levels?
Support and resistance lines identify areas of significance on a chart. These levels can be represented by horizontal or sloping lines.
Support
Support lines show the lowest price the market will accept before buyers are likely to drive up prices.
Resistance
Resistance lines show the highest price the market will accept before an influx of sellers is likely to drop prices.
These lines help traders understand the flow of the market. Horizontal support and resistance lines help traders quickly spot the highest and lowest price the market has accepted. When these lines are established, traders often preload sell orders at the previous high (resistance level), and buyers do the opposite at the support level (previous low).
Trendlines are often support and resistance lines, and the terms are often used interchangeably.
Register Olymp Trade & Get Free $10,000 Get $10,000 free for newbies
How Do Trendlines Work?
Essentially sloping support and resistance lines, however, they show the “trend” of buying pressure. Unlike horizontal support and resistance levels, trendlines show the strength of buyers in the market by linking the highest or lowest points in a trend to reveal points when prices are likely to make a move with or against the trend.
How to Draw a Trend Line – Correctly
Whether you are looking to make horizontal or sloping trendlines, these are the steps to make sure the line is plotted correctly.
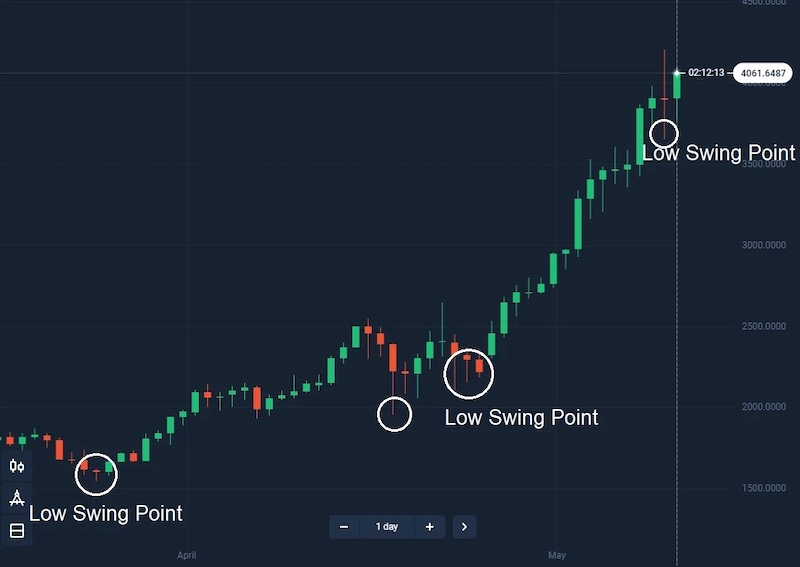
- Focus on the largest swing points – small fluctuations are not important.
- Connect at least two significant swing points – More points of contact equal more accuracy.
- Adjust the line to get the most touches – whether it is the body or wick.
Here’s an example:
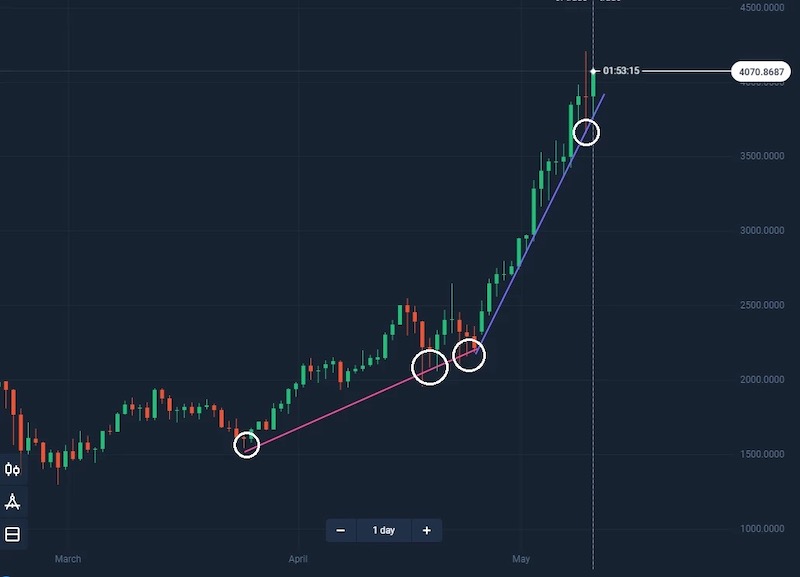
You can draw two parallel Trendlines to define an area on your chart. In this example, the second line is the resistance level for a channel the asset trades within before breaking out on a stronger uptrend.
The price tests this level four times before breaking through it.
Unlike horizontal, Support and Resistance trend lines need to be adjusted. That is why there are two different slopes on the chart above.
Adjustments can happen in either direction, and a trend can pick up momentum leading to longer candles and steeper inclines.
Prices can breakthrough a trendline and return to it. Trends can reverse or intensify, and the line helps traders see the probable outcome.
Trend lines are not solid objects on the chart, they can be broken or strengthened. They are a tool, not a guarantee.
Register Olymp Trade & Get Free $10,000 Get $10,000 free for newbies
Vertical Lines
These are not trendlines but are still extremely useful in trading. They help mark intervals, allowing traders to find a different pattern within intervals, to mark the turning point in a trend or important news on the chart.
More Than a Line – Area of Interest
Any support, resistance, or trend line is not only a line but an area. When creating trendlines, there will often be portions of candles that extend beyond them. They help define the range of the Area of Interest.
This area helps traders define when price action is probable. Areas of Interest are also used in trading strategies as entry and exit points for trades. Understanding this bit of trading psychology can give traders an advantage.
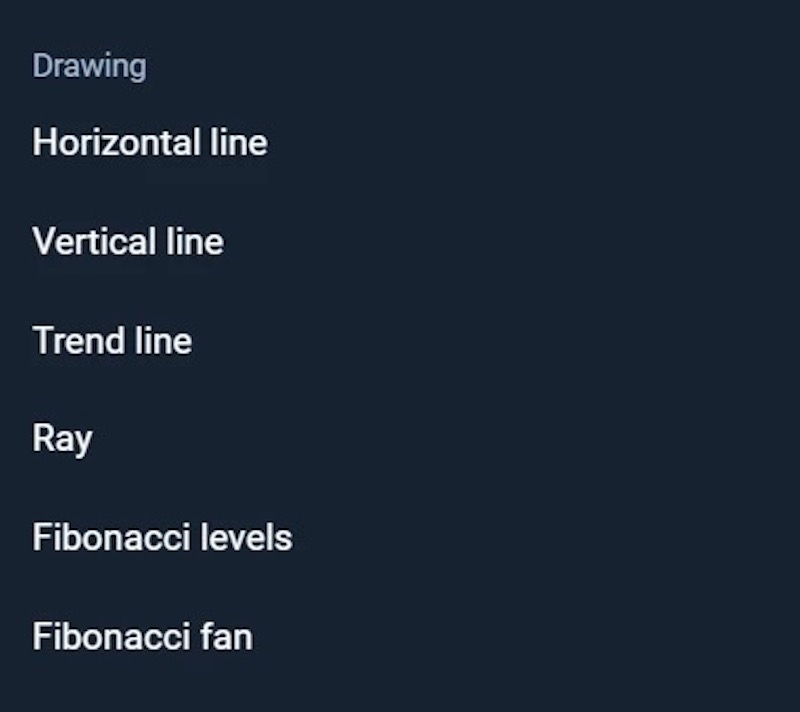
Please remember that the full list of tools for drawing trend lines and other elements of chart analysis сan be found in the “Indicators” section of the Olymp Trade platform.
Register Olymp Trade & Get Free $10,000 Get $10,000 free for newbies
How to Use Trendlines
Trendlines can give a lot more information than just whether a trend is up or down. Adjusting and drawing new trendlines allows traders to see the change in a trend over time.
If trendlines begin to flatten, the trend is likely moving into a channel. Use horizontal support and resistance levels to track the range and prepare for the eventual breakout.
If trendlines get steeper, the trend is becoming stronger; or in the case of parabolic (extremely steep) increases, the asset could be going into a buying climax.
Take note of changing market conditions and adjust your trading strategy accordingly. Trading the exact same way in all market conditions leads to losses.
Register Olymp Trade & Get Free $10,000 Get $10,000 free for newbies
Trading With Trendlines – A Simple Strategy
Trendlines can be used to determine entry and exit triggers. This simple strategy uses horizontal and sloping trendlines combined.
The best trading opportunities are near the trendline.
Find the trend and set a sloping trendline.
Set horizontal Support and Resistance levels.
Where the sloping trendline and horizontal lines intersect are Areas of Interest. The probability of large price movement is possible at these points.
When prices hit these intersections, buyers or sellers are often prepared to make a big push.
Prices will often move aggressively with the trend.
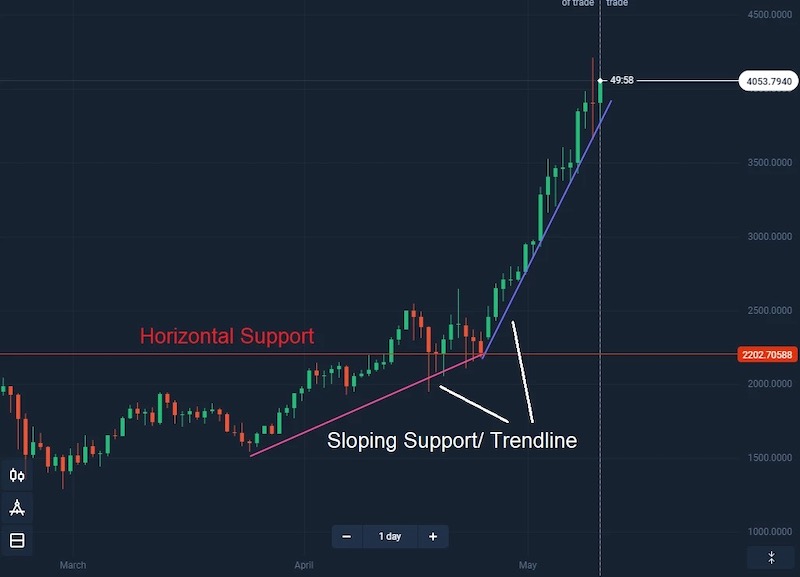
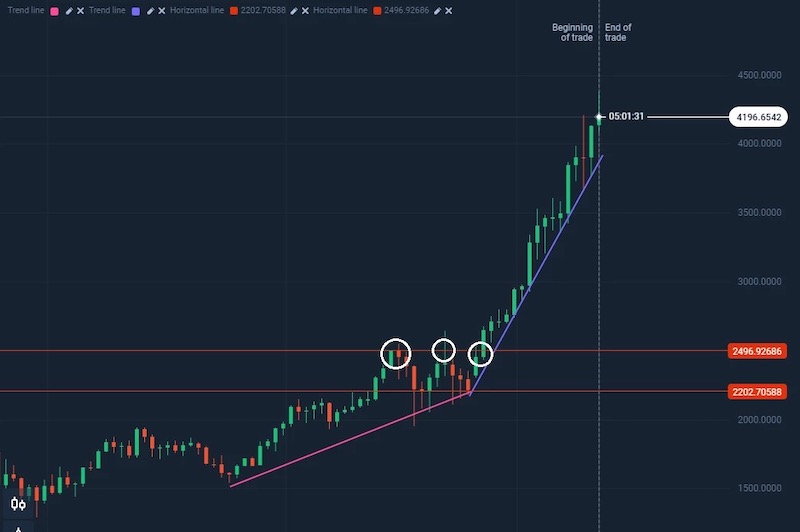
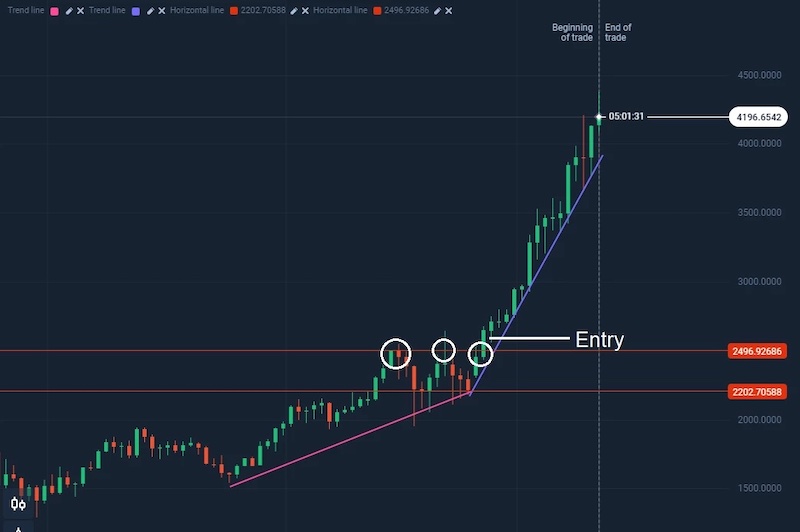
In the screenshot below, the horizontal lines create the boundaries for the price channel before quotes broke higher.
Prices test the resistance line four times before breaking through on the fifth. This break showed the strength of the coming trend, because prices had broken past the resistance level twice before. Combined with the higher lows barely passing the upward sloping trendline indicate a strengthening of the uptrend.
Conclusion
Trendlines are a simple yet powerful tool in a trader’s arsenal. Chart a trend, indicate resistance and support and discover areas of interest along with a wealth of information.
Utilize them in trading strategies to bring more accuracy into technical analysis. This article did not cover Fibonacci Levels or Fans, because that is an article all its own.
Take the time to practice and really understand the full range of use these lines provide.
![]() English
English ![]() हिन्दी
हिन्दी ![]() Indonesia
Indonesia ![]() Português
Português ![]() Tiếng Việt
Tiếng Việt ![]() العربية
العربية ![]() ไทย
ไทย


")
 General Risk Notification: Transactions offered by Olymp Trade can be executed only by fully competent adults. Transactions with financial instruments offered on Olymp Trade involve substantial risk and trading may be very risky. If you make Transactions with the financial instruments offered on Olymp Trade, you might incur substantial losses or even lose everything in your Account. Before you decide to start Transactions with the financial instruments offered on Olymp Trade, you must review the Service Agreement and Risk Disclosure Information. Olymp Trade is operated by Saledo Global LLC; Registration number: 227 LLC 2019; Registered Office Address: First Floor, First St. Vincent Bank Ltd Building, P. O Box 1574, James Street, Kingstown, St. Vincent & the Grenadines.