
![]() English
English ![]() हिन्दी
हिन्दी ![]() Indonesia
Indonesia ![]() Tiếng Việt
Tiếng Việt ![]() العربية
العربية
The trendline indicator combined with the ladder pattern is one of the effective methods of determining the price trend. Unlike reversal strategies/methods, this helps to find out whether the market will continue to grow or not. You can make a long position that is relatively safe.
What is the ladder candlestick pattern?
The ladder pattern indicates that the price is moving in one direction, or in other words, the price trend is quite clear.
When the price moves in a trend, there will be an irregular up and down movement. However, there will be times when a large number of sessions repeat, increase, or decrease in a certain direction. We call them the ladder pattern because their shape is very similar to the steps going down or up. For example, as shown below.
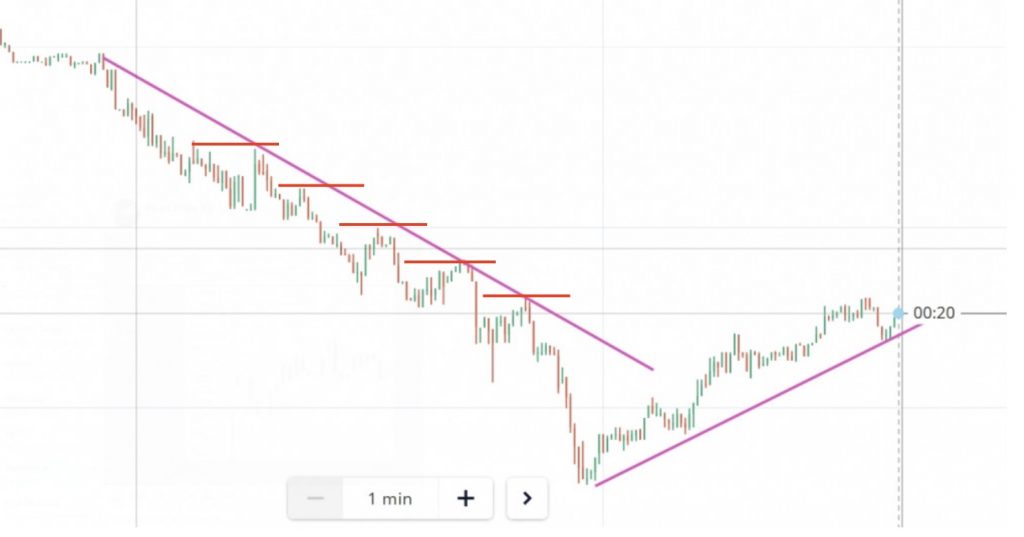
This ladder candlestick pattern won’t make much sense when you see them. But it will be extremely important every time the price reverses at each ladder. Even more special is identifying the foot of the ladder, the time when the price will completely reverse.
Register Olymp Trade & Get Free $10,000 Get $10,000 free for newbies
Combine Trendline and ladder pattern
Define
The Trendline indicator is used to determine the morphology of the ladder pattern more accurately.
Guide to using Trendline for 30-minute trading
From these detected ladder lines, the corresponding support/resistance lines will be easy to be seen. Once the price starts to reverse completely in the opposite direction, we will use these support/resistance lines as the base.
Register Olymp Trade & Get Free $10,000 Get $10,000 free for newbies
Analysis basis
Because the analysis shows that the price will fluctuate according to the rule of the previous respective price range. Each step that prices fluctuate on the reverse trend of the market will be the same with previous data.
Instructions for opening transactions use Trendline and Ladder.
After the price has fully reversed, there will be two perfect times:
Price reaches Support and Resistance
Every time the price hits support/resistance is the perfect time to enter a short position. In these positions, you have to apply the usual rules of Support/Resistance indicator. Between these Support/Resistance levels.
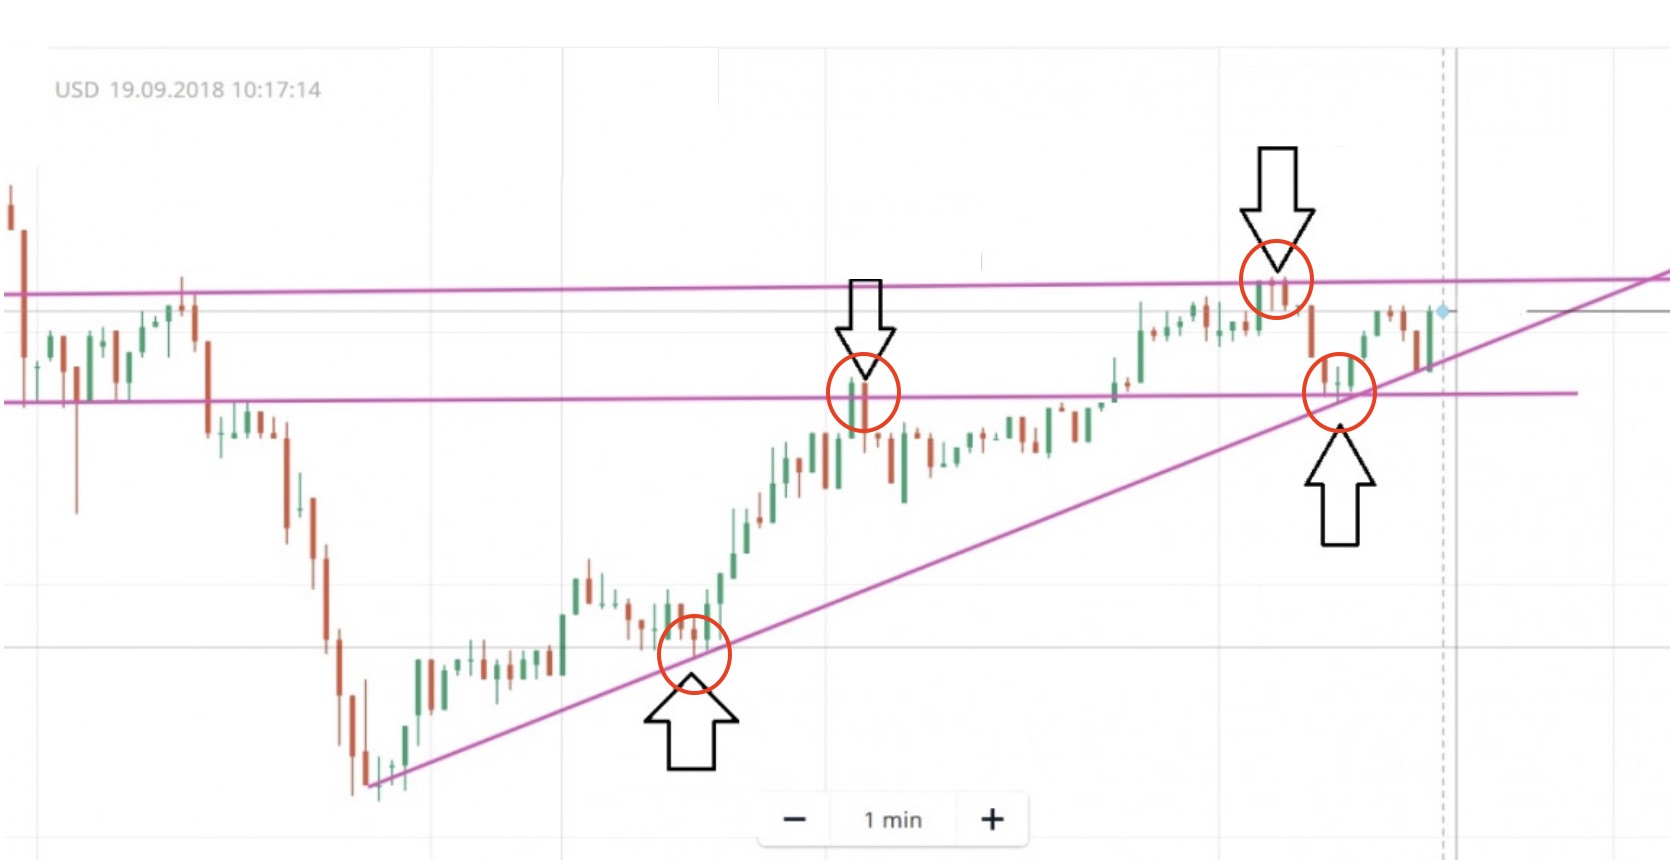
Price hits the Trendline
For the uptrend, the Trendline will be below the price chart. For the downtrend, a Trendline will be plotted above the price chart.
Every time the price hits the trendline, it is the right time to enter long-term orders. Because although the price fluctuates slightly following the ladder, it still follows the rule of upward or downward of the Trendline. Long positions are always very safe.
Note
The price will repeat the rules at the respective price range. When the price returns to the balance, it is also time to reinstall the Trendline indicator and ladder pattern. The probability of the price going tactically is 80%, you will surely succeed even if you miss at the end of the ladder.
Olymp Trade is currently the best trading platform with the trust of over 3 million Traders worldwide. Sign up now to receive the $10,000 discount via the form below:
![]() English
English ![]() हिन्दी
हिन्दी ![]() Indonesia
Indonesia ![]() Tiếng Việt
Tiếng Việt ![]() العربية
العربية


")


")
 General Risk Notification: Transactions offered by Olymp Trade can be executed only by fully competent adults. Transactions with financial instruments offered on Olymp Trade involve substantial risk and trading may be very risky. If you make Transactions with the financial instruments offered on Olymp Trade, you might incur substantial losses or even lose everything in your Account. Before you decide to start Transactions with the financial instruments offered on Olymp Trade, you must review the Service Agreement and Risk Disclosure Information. Olymp Trade is operated by Saledo Global LLC; Registration number: 227 LLC 2019; Registered Office Address: First Floor, First St. Vincent Bank Ltd Building, P. O Box 1574, James Street, Kingstown, St. Vincent & the Grenadines.