
To profit in Forex, traders need to make correct price forecasts. There are two types of activities that help produce such correct forecasts. The first is observing and analyzing the trading asset chart patterns, which is technical analysis. The second is fundamental analysis, which is understanding the economic factors that influence the price. Understanding the nature of each and the difference between them helps find the right balance of the two to best fit each trader’s objectives.
The Essence of Technical and Fundamental Analysis
Fundamental analysis examines the real-world factors that impact the price of a trading asset.
The purpose of fundamental analysis is to understand whether the value of a trading asset is expected to rise or fall over the weeks, months and years and why. Therefore, the problem is often long-term trading and investing.
Technical analysis focuses on price charts, patterns, indicators, and trends. They often provide a good read of current price behavior and market sentiment.
The purpose of technical analysis is also to understand where the price of a trading asset is headed. However, unlike fundamental analysis, technical analysis is generally concerned with short-term and medium-term price forecasts.
Therefore, both types of analysis have the same goal, which is price forecasting. However, they differ in method and execution time.
Register Olymp Trade & Get Free $10,000 Get $10,000 free for newbies
How to Do Fundamental Analysis
Basically, fundamental analysis is about studying your preferred trading asset.
It shows that you understand the nature of your asset, the factors that influence its price, the broader context of the market sector or industry, and the relevant strategic dynamics in the economy.
For currency pairs, learn about the monetary policy of the central bank whose currency you are trading.
Ask yourself: Are you trading major global reserve currencies like the US dollar or euro that should be stable over the long term? What is a volatile currency pair of regional significance like AUD/NZD? Can a local currency like the Turkish lira lose or gain hundreds of percent in value in a few weeks?
For stocks, understand the nature of the line of business and the economic landscape in which your trading asset are located.
Register Olymp Trade & Get Free $10,000 Get $10,000 free for newbies
If you like stocks, you’ll want to know whether you’re trading a high-tech stock like Nvidia that is likely to be affected by chip shortages or a century-old global beverage maker like Coca-Cola.
This is the type of information you will use to begin your fundamental analysis.
How do you answer the questions asked by fundamental analysis? Read. Here are some suggestions for what to read:
- Corporate news relevant to the stock you trade on.
- Central bank reports relevant to the currency pair you trade.
- News that is likely to affect the price of your trading asset.
Here are some real-case examples of fundamental analysis for oil, a currency pair and stock.
Examples of Fundamental Analysis Approaches
Brent Crude Oil
If you trade Brent, read the latest news from OPEC+ for their estimates of future oil demand and their possible policies. Research global geopolitics and energy issues that may affect it, such as the decades-long sanctions on Iran. Let’s see who are the major oil consumers in the world and how their economies are doing. For example, if China’s economic growth outlook is optimistic, the country may need to increase its oil supply, which should support oil prices. If the Chinese economy is held back by a number of factors that could slow economic expansion, the country may need less oil and Brent will face downward pressure.
USD/MXN
If you are trading Mexican peso, read the latest data and listen to press conferences from the Mexican Central Bank. Understand how you plan to manage your value weight. Look at the general state of the Mexican economy relative to the US economy as this will greatly affect the common position between MXN and the dollar. See the Mexican President’s recent statement to understand the general direction Mexico is likely to take. Take a look at the dynamics of the US economy and the comments of the US Federal Reserve Chairman which will provide an insight into the future of the US dollar. Together they will give you an idea of where USD/MXN is likely to go.
Alibaba
Understand what Alibaba’s market segment is and who its competitors are. It is significant because Amazon and eBay operate in roughly the same industry, so their performance will indirectly affect Alibaba’s performance. Read your most recent financial reports to see your performance first hand. Identify potential reasons for Alibaba’s momentum to get a fair prediction of where you’re likely to head. Put everything in the context of Ali Baba’s homeland. Since the Chinese authorities began cracking down on the Chinese IT industry in 2021, Alibaba’s stock has experienced an almost continuous decline. This means that once completed, the stock can go up again. When will this end, and will it end? This will determine Alibaba’s future growth potential, and doing thorough research can help you understand it better.
Register Olymp Trade & Get Free $10,000 Get $10,000 free for newbies
How to Do Technical Analysis
Basically, technical analysis is when you look at a price chart and make a price prediction based on what you see. There are many ideas that lie at the heart of this activity.
Find Trends on the Price Chart
Technical analysis shows that future price behavior can be predicted based on their past performance, at least to some extent. This hypothesis leads to a target that identifies the direction of the price movement that you observe and expect in the future. This forecast is intended to show investors that the price of their trading asset may be inclined to open a trade accordingly.
For example, in the chart below, we have Ethereum price performance over a period of 15mins.
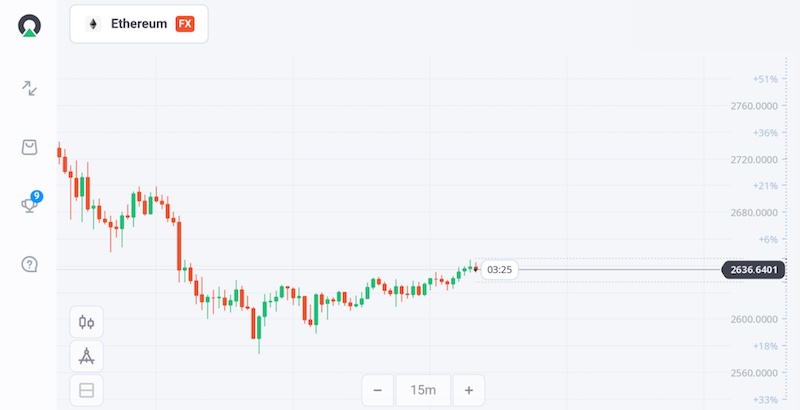
Technical analysis will immediately show that there is a particular trend in what value does in the chart. This trend will be predicted later in the future. As a result, marketers will now have a reason to buy Ethereum with the expectation that it will likely become more expensive for a period of time as it moves higher with the trend.
Combine Several Time Frames
If we were to make trading decisions based on one direction, it would be reckless. Watching price work in a single timeframe provides a very narrow perspective to make the right decisions. Instead, once we find a trend, we change the timeframe and work with Zoom In/Zoom out to get everything into the frame.
The combination of multiple timeframes always leads to a better understanding of price action.
For example, here is the time frame of 30mins views for Ethereum.
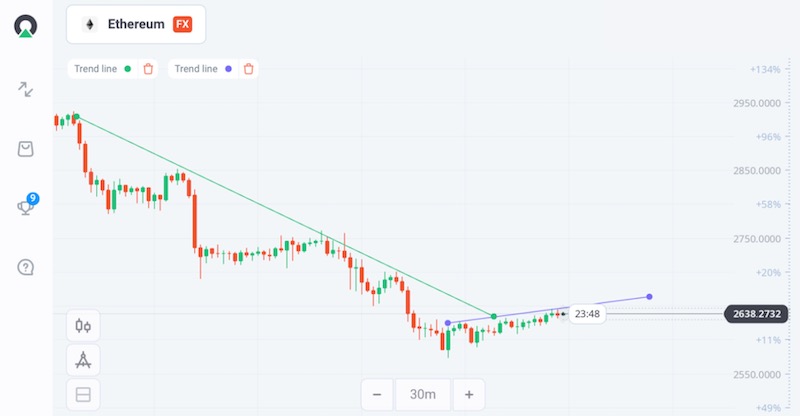
The uptrend we saw before is no longer obvious, it appears right after a larger downtrend. Therefore, we cannot be certain that the bearish momentum has weakened. Is there a way to rate it? Yes, see what price does with support and resistance levels.
Register Olymp Trade & Get Free $10,000 Get $10,000 free for newbies
Use Resistance and Support Levels to Assess Trends
Resistance is the “ceiling of resistance” when the price has risen. This level is usually expected when the price is high or high enough.
One of the support levels is the “support floor” of the price since the fall. This level can be reached when the price is too low or too low.
Both are fundamental to analysis. Breaking of resistance levels often leads to the conclusion that the price is likely to rise. A break of support levels is often taken as a sign that prices may fall.
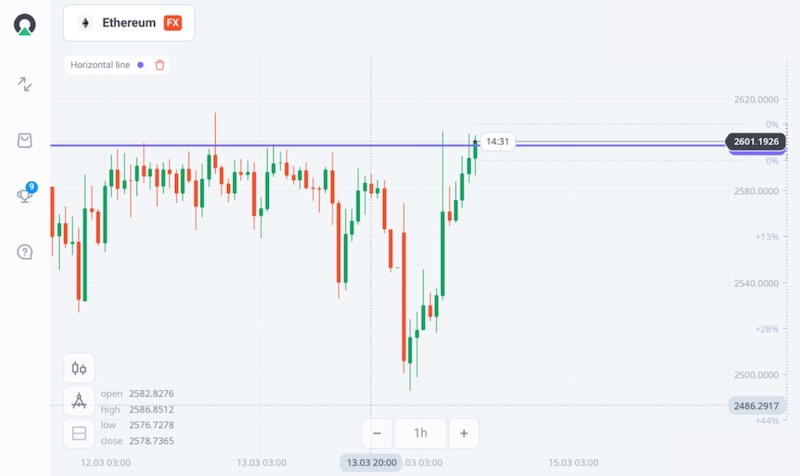
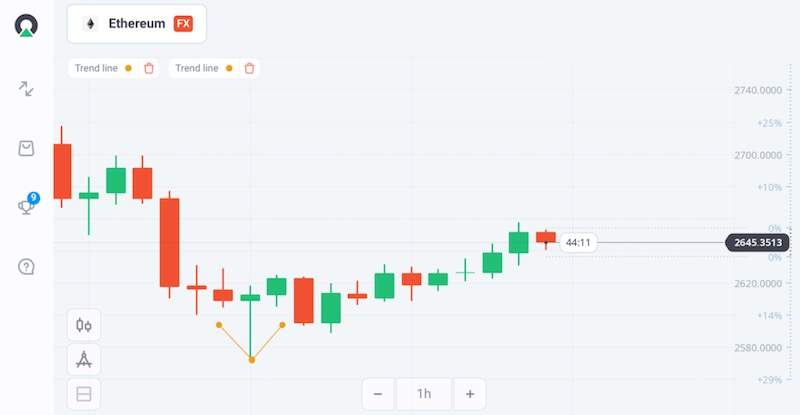
For example, on the Ethereum chart below, we see that the price was below $2,600 on March 12 and 13. On several occasions, he fell a little and then climbed back up there. Currently, at the time of observation, the value is testing this resistance level. If it breaks, it will be a sign that the new uptrend will resume above $2,600.
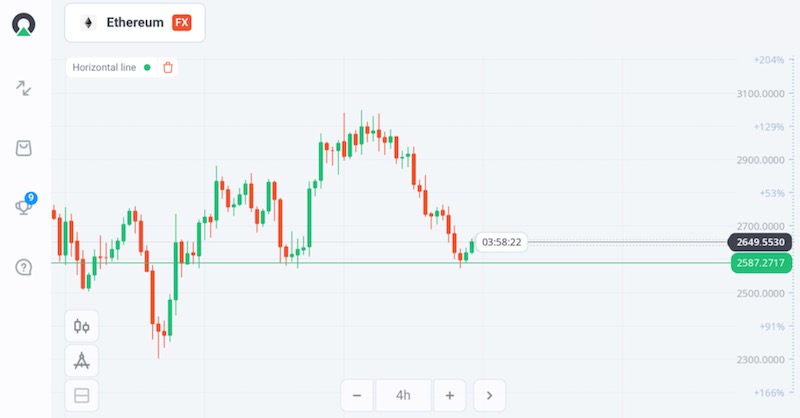
Meanwhile, if we go to 4 hours, we will see that the current price area is the support area that the price was before. This suggests that the price could bounce back to where it was before at this level.
Check Price Chart Patterns
Traders often use candlestick formations and charts to predict price behavior.
For example, on Ethereum’s 1-hour timeframe, the new uptrend we are seeing is preceded by a green candle with a long shadow and thin body. This candle is known as the Pin Bar and is generally considered a trend reversal.
There are many types of charts and candlesticks that are used to identify trends and trends. Many of them are analyzed in the help center of the platform, so traders can easily find what they need.
Register Olymp Trade & Get Free $10,000 Get $10,000 free for newbies
Combine Technical and Fundamental Analysis
We recommend using a combination of technical and fundamental analysis. Both provide important insights into the price action of any trading asset and help you make accurate price predictions. In the help center of Olymp Trade, beginners can find useful information for technical and fundamental analysis. For Type 1 and Type 2 analysis, advanced traders can do the same. Learn and practice!


")


")
 General Risk Notification: Transactions offered by Olymp Trade can be executed only by fully competent adults. Transactions with financial instruments offered on Olymp Trade involve substantial risk and trading may be very risky. If you make Transactions with the financial instruments offered on Olymp Trade, you might incur substantial losses or even lose everything in your Account. Before you decide to start Transactions with the financial instruments offered on Olymp Trade, you must review the Service Agreement and Risk Disclosure Information. Olymp Trade is operated by Saledo Global LLC; Registration number: 227 LLC 2019; Registered Office Address: First Floor, First St. Vincent Bank Ltd Building, P. O Box 1574, James Street, Kingstown, St. Vincent & the Grenadines.