 inside Bollinger Bands - Trading Strategy")
![]() English
English ![]() हिन्दी
हिन्दी ![]() Indonesia
Indonesia ![]() Tiếng Việt
Tiếng Việt ![]() العربية
العربية
In currency trading on brokers, the trading strategy of RSI indicator combined with Bollinger Bands is very useful for trading orders over 30 minutes with 2-minute candles. This article will guide you on how to make a trade with the Relative Strength Index (RSI) indicator combined with the Bollinger Bands indicator.
*The article uses illustrations of the Olymp Trade broker platform
RSI & BB
Technical
- For understanding RSI indicator: https://traderrr.com/relative-strength-index-rsi-indicator-definition-and-using-guide/
- Guide about Bollinger Bands indicator: https://traderrr.com/what-is-bollinger-bands-and-how-to-use-it/
This strategy simply uses a combination signal between the divergence of the RSI indicator and the bottleneck signal of the Bollinger Bands indicator. These two signals simultaneously inform us that volatility is coming. Whether the price will go up or down depends on their signal.
Basically, RSI & BB usually use:
- Bollinger Bands(20,2)
- RSI(14) or RSI(9)
Register Olymp Trade & Get Free $10,000 Get $10,000 free for newbies
Suitable for long term transactions
The reason why this strategy is only suitable for long-term trading is the divergence and bottleneck signals of these two indicators need a little time to confirm. It takes about 5 to 8 sessions. Traders usually set 1-minute session for 10-minute trade, 2-minute session for 30-minute trade, and 5-minute session for 60-minute trade.
RSI – Bollinger Bands signals
The condition of RSI & BB is when the RSI indicator shows divergence signals with the candlestick chart. At the same time, Bollinger Bands are bottlenecked or moving stable without much fluctuation in narrow bands.
An entry for a rising trade
You make a trade when the RSI indicator shows signs of crossing the zero line to the upper. At the same time, the upper and lower bands of the Bollinger Bands indicator are extended upwards. If the Japanese candlestick surpasses the SMA line of the Bollinger Bands, you should open a long Up / Buy trade immediately.

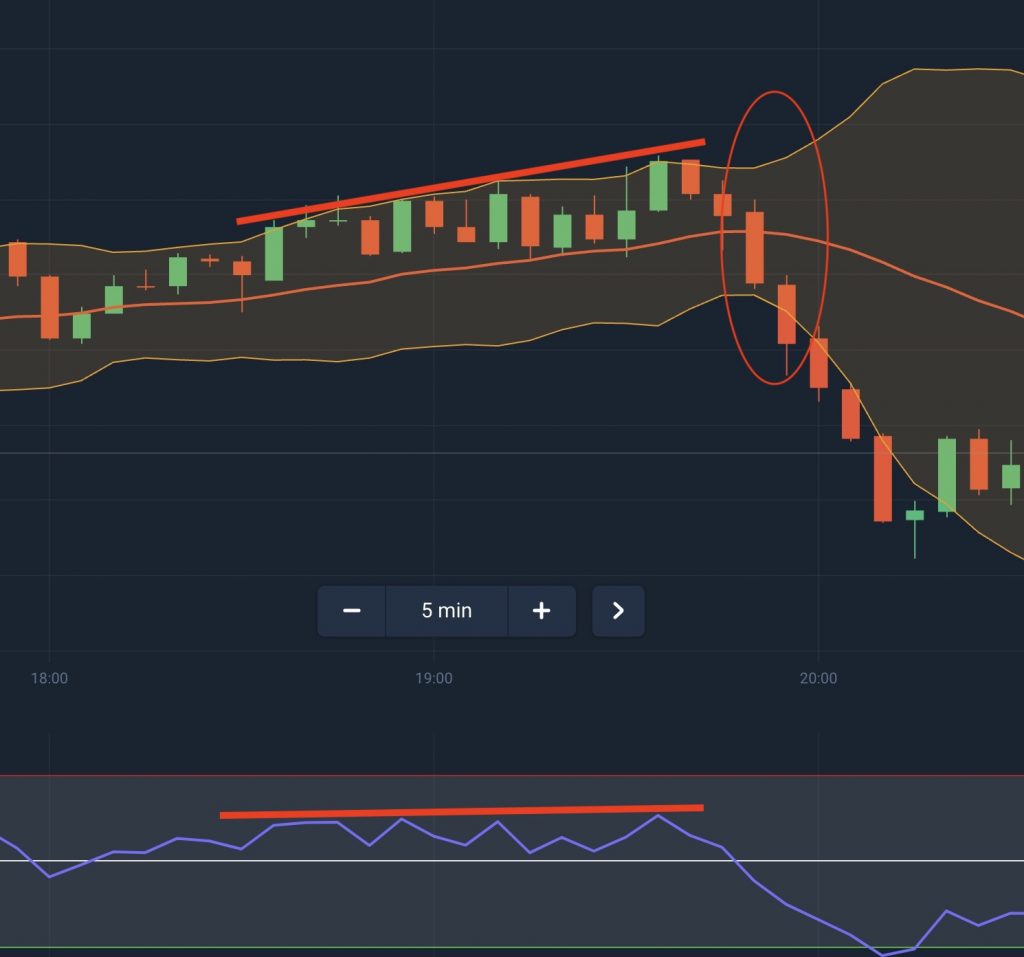
Signal to enter a falling trade
On RSI & BB, when the RSI crossed the Zero line and the Bollinger Bands signaled the expansion of the upper band and the lower band bigger and downward. The candlestick moved below and far away from the SMA of the Bollinger Bands, so now you should enter a long Down / Sell trade.
Note
When trading with RSI & BB, make sure you always follow the rules:
- Do not enter short trades for less than 30 minutes.
- Need to wait for the signal of the Bollinger Bands moving balance with the narrow band line.
- If RSI indicators do not diverge, make no trade.
- Just play a single trade at once. You should not make multiple trades.
- It is possible to incorporate a Stochastic oscillator indicator to increase accuracy.
![]() English
English ![]() हिन्दी
हिन्दी ![]() Indonesia
Indonesia ![]() Tiếng Việt
Tiếng Việt ![]() العربية
العربية


")


")
 General Risk Notification: Transactions offered by Olymp Trade can be executed only by fully competent adults. Transactions with financial instruments offered on Olymp Trade involve substantial risk and trading may be very risky. If you make Transactions with the financial instruments offered on Olymp Trade, you might incur substantial losses or even lose everything in your Account. Before you decide to start Transactions with the financial instruments offered on Olymp Trade, you must review the Service Agreement and Risk Disclosure Information. Olymp Trade is operated by Saledo Global LLC; Registration number: 227 LLC 2019; Registered Office Address: First Floor, First St. Vincent Bank Ltd Building, P. O Box 1574, James Street, Kingstown, St. Vincent & the Grenadines.