


![]()
![]()
![]()
![]()
![]()
Bollinger Bands indicator
High-quality technique
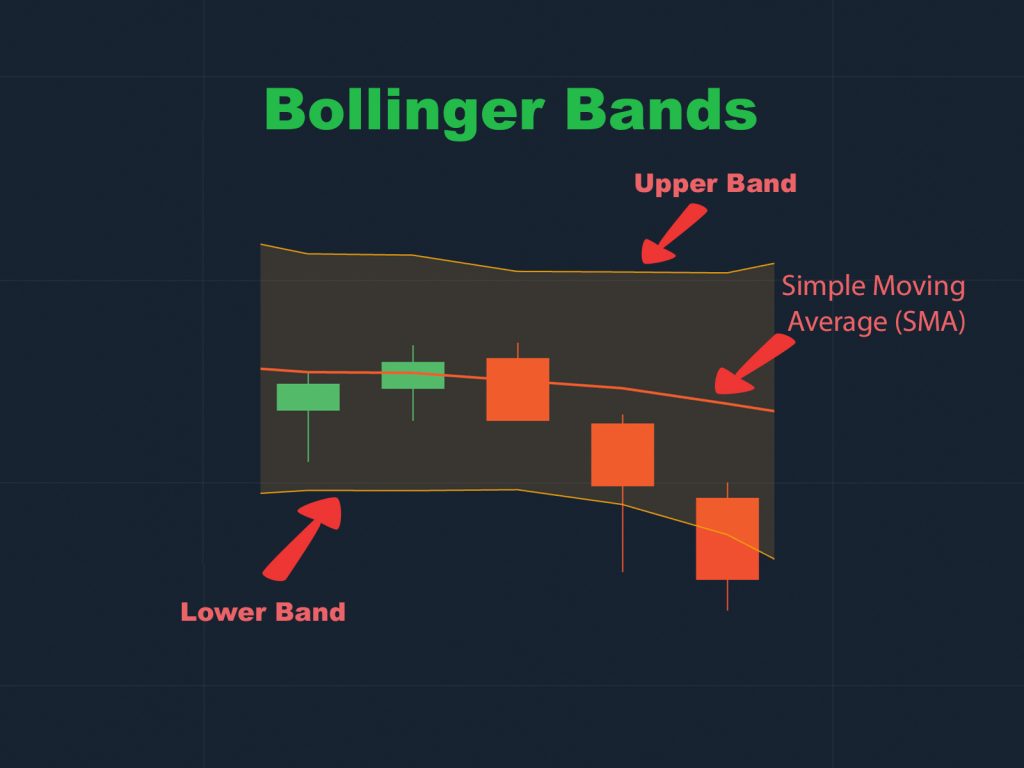
Bollinger Bands is a technical analysis tool defined by a combination of three sets of indicator lines, including a Moving Average band (SMA) in the middle and two standard deviations (Upper Band and Lower Band). They are used to calculate the relative high and low prices of the market. And can also be adjusted according to user preferences based on session setup time.
Register Olymp Trade & Get Free $10,000 Get $10,000 free for newbies

How to calculate Bollinger Bands
The Bollinger Bands formula:
BOLU = SMA (CLOSE, N) + k ∗ StDev
BOLD = SMA (CLOSE, N) −k * StDev
Where:
- BOLU: Upper Bollinger Band
- BOLD: Lower Bollinger Band
- SMA: Middle Bollinger Band – Formula to calculate the moving average – The average of all CLOSE values in n periods.
- CLOSE: The price of the end of each period.
- n: Number of periods applied.
- k: Standard deviation coefficient, usually 2-3.
- StDev: Standard Deviation
StDev = SQRT(SUM((CLOSE – SMA(CLOSE, N)^2,N)/N)
Inside:
- SQRT: Square Root
- SUM (…, n): Sum in n periods
- SMA (…, n): Average moving on n
- n – Number of periods applied.
When constructing Bollinger Bands, we usually use the standard deviation factor k equal to 2. At this value, 95% of the price will be in the price range, limited by the Bollinger Bands.
How to use the Bollinger Bands indicator
Transactions follow the middle indicator line
If the price crosses the middle line, it is a sign of an increase. If the price crosses the central line, it is a bearish sign. You can enter orders based on this signal.


Trade after the price is out of the Band
You will be able to place an order after the price goes out of the Bands and then touch either of the outer bands. Here you can only place a short order. If you reach the lower Band, you set an Increase order, if touching the upper Band, then put a Decrease order.


Use the outside lines that just touch the Bands
The indicator lines are adjusted to form a dynamic support/resistance level for the current price movement. When the indicator line reaches a higher resistance level, you can proceed to sell, and when it approaches the lower support level, you can continue to buy in the event of a reversal.


Signal of bottleneck
A reliable signal when using Bollinger Bands is that the bottleneck phenomenon occurs when the upper Band and lower Band constitute bottlenecks. This signals we know forthcoming events in the market price. The direction of the price will be fixed shortly after getting off the bottleneck, and you have to take advantage of this moment to trade.
Session
Bollinger Bands generally recommended being used only for short trading sessions i.e., from 10 to 20 minutes/period. The longer the time, the better the accuracy of the indicator.
Advice
John Bollinger has noted for himself the following characteristics of the indicator he gives:
- Sudden price changes usually occur after the range narrows, which means that volatility decreases.
- If the top and bottom outside the indicator line are followed by the top and bottom inside the indicator line, it could be a signal of a trend reversal.
- The price movement that starts on one side of the indicator line touches the opposite side usually. This observation is useful for predicting benchmark prices.
- Remember that the professional settings of the Bollinger Bands require traders to have extensive knowledge and good training.
Register Olymp Trade & Get Free $10,000 Get $10,000 free for newbies
![]()
![]()
![]()
![]()
![]()


")
