

 definition and how to use it")
![]()
![]()
![]()
![]()
![]()
What is the SMA indicator? This is an indicator that you can expect the price to change direction should buy or sell. Combining the basic SMA indicator with many other indicators will show the best results.
Register Olymp Trade & Get Free $10,000 Get $10,000 free for newbies
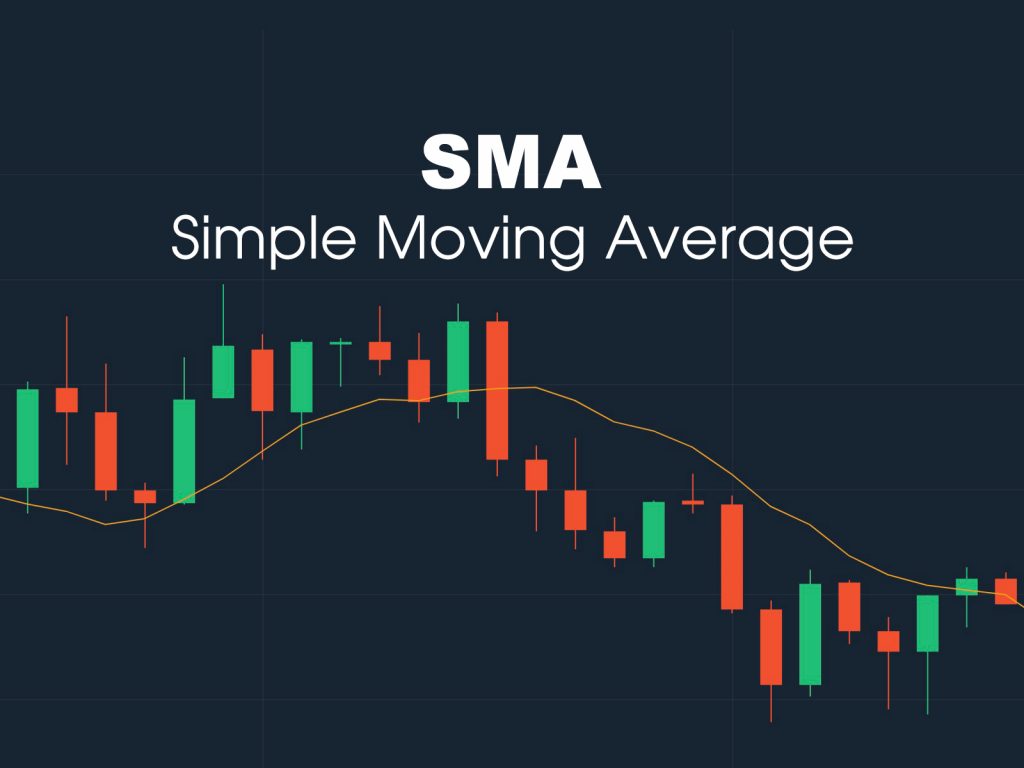
What is the SMA indicator?
Simple Moving Average (SMA) is the most basic of all statistical probability formulas. Although basic, professional traders are still using this indicator in trading because SMA is the basis of all other indicators and also gives traders views of the market.

How to calculate Simple Moving Average
The SMA is the average of the previous n sessions with the last value of each session. SMA is calculated by the formula:
SMA = SUM (CLOSE, n) / n
SUM (CLOSE, n) = CLOSE (1) + CLOSE (2) + CLOSE (3) + … CLOSE (n)
Where:
- n is the number of sessions.
- CLOSE is the value at the end of the session
- SUM (CLOSE, n) is the sum of n sessions, taking every last value at the end of the transaction (CLOSE).
For example, SMA-9 means that each point of the SMA line is the average of the last value of the previous 9 sessions.
Signals of SMA indicator
Price graphs cross over SMA
If you use short-term SMA, for example, below 50 sessions. It would be a good signal if:
- The price chart is falling down and crossing the SMA line by top-down. This is the time when prices are likely downward. This is the time to sell.
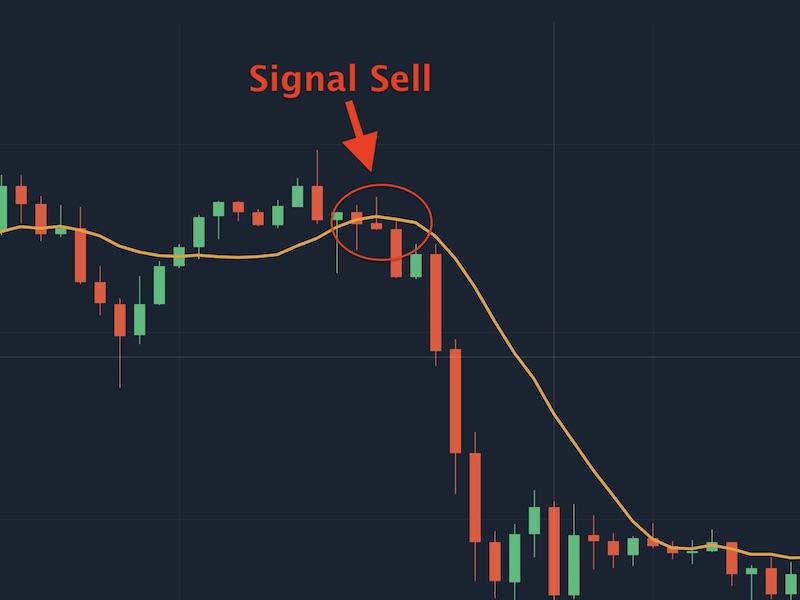
The price graph crossed the SMA and goes down as a sell signal - Similarly, if the price chart rises rapidly and crosses the SMA line from the bottom to top. This signal is about to prepare for an increase. You should be ready to buy it. But don’t forget to set a STOP LOSS. Risk of losses can occur no matter what signal you catch.
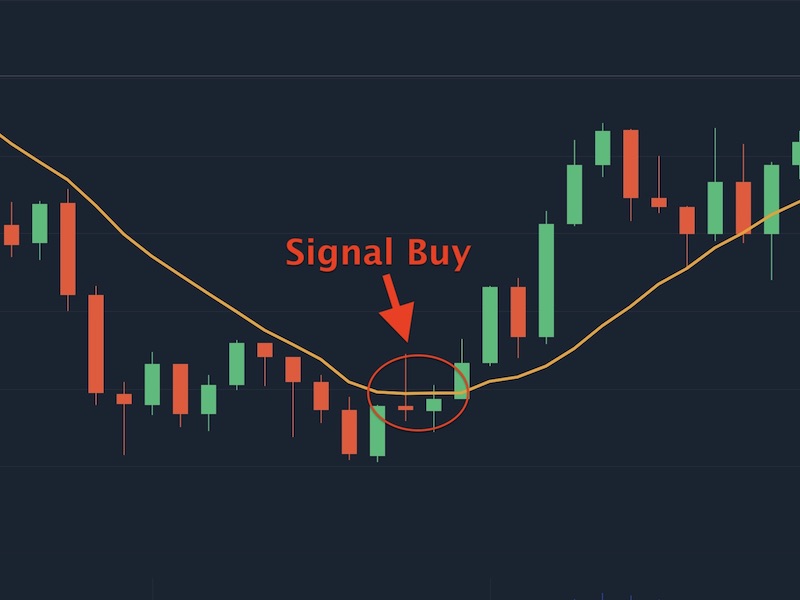
You should buy when price chart crosses over the SMA and goes up

Use two SMA, one short and one long
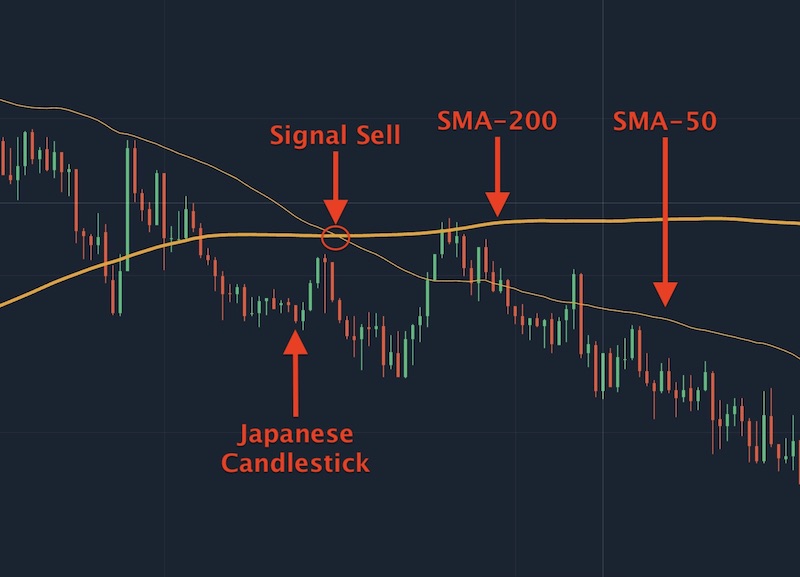
You can use two indicators, ie SMA-50 and SMA-200. Particularly, the SMA-200 indicator line will not change much because it is a stable long term average price. By this way you will get signals Buy/Sell when:
- SMA-50 moves quickly down then cuts SMA-200 like a waterfall. This is similar to the price chart cross over SMA. This signal is telling you to sell to take profits.
Sell signal appear when SMA-50 crosses over SMA-200 and goes down - Similarly, when the SMA-50 moves quickly upwards and cuts through the SMA-200 line from the bottom. The price is showing signs of a strong increase, and this is the time to buy.
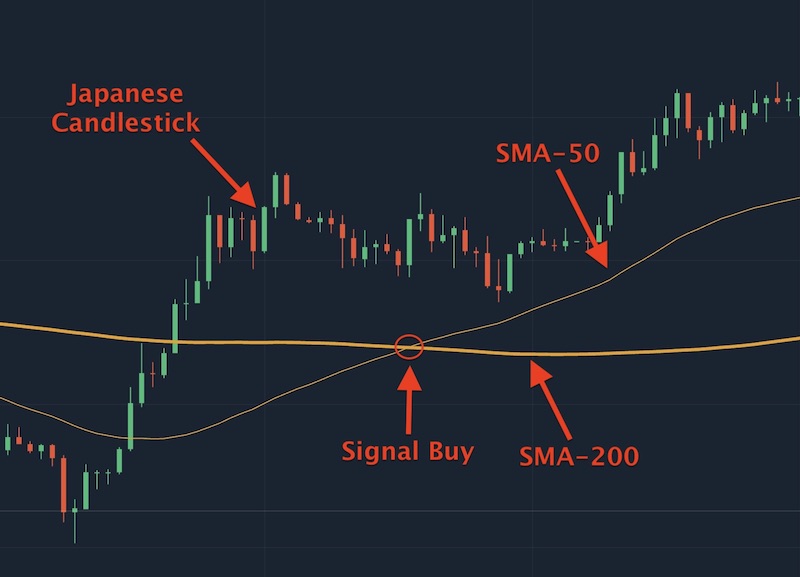
The Line SMA-50 crossed the SMA 200 from the bottom and goes up is buying signal

These are the two most obvious signals, do not enter the buy/sell order when the SMA-50 only moves to one side of the SMA-200, whether it rises or falls sharply. We have to use the method described below to increase accuracy.
Combine two SMA indicators with the price factor
The signal will become stronger if you add the price factor to the formula using the two SMA indicators mentioned above. This means the following:
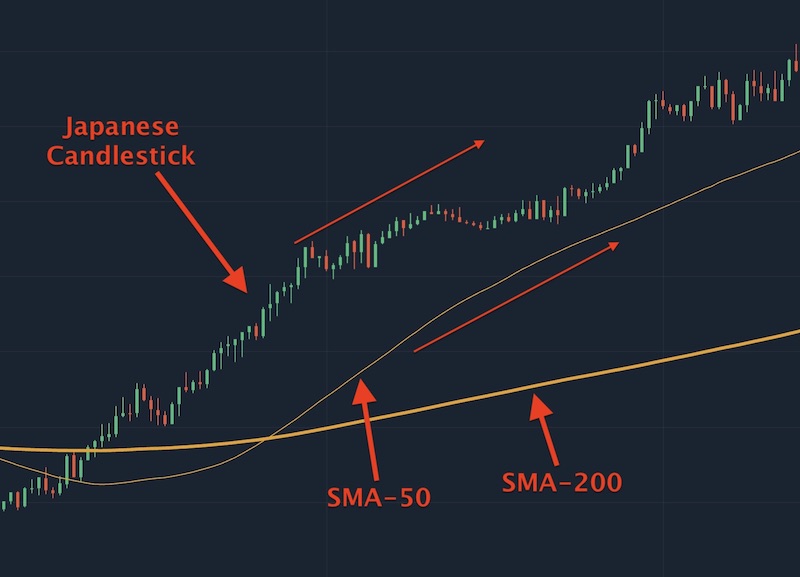
- When the SMA-50 is moving above the SMA-200, at the same time, the price chart is moving above the SMA-50. At this time, the SMA-200 has confirmed the direction of the price chart. The upward price chart, together with the no signs of cutting the SMA-50, will show that the price is the upward trend. Your handle now is to wait for a violent signal of the SMA-50 to go down to take profit.
The price will stable when SMA-50 is above SMA-200 and price graph is above SMA-50 in the same direction - In contrast to the above case, when SMA-50 moves below SMA-200, at the same time, the price chart moves below SMA-50. Similarly, it has confirmed that the development of assets is in a downtrend. You will wait for the price chart to stop falling and cut SMA-50, that is the time to buy.
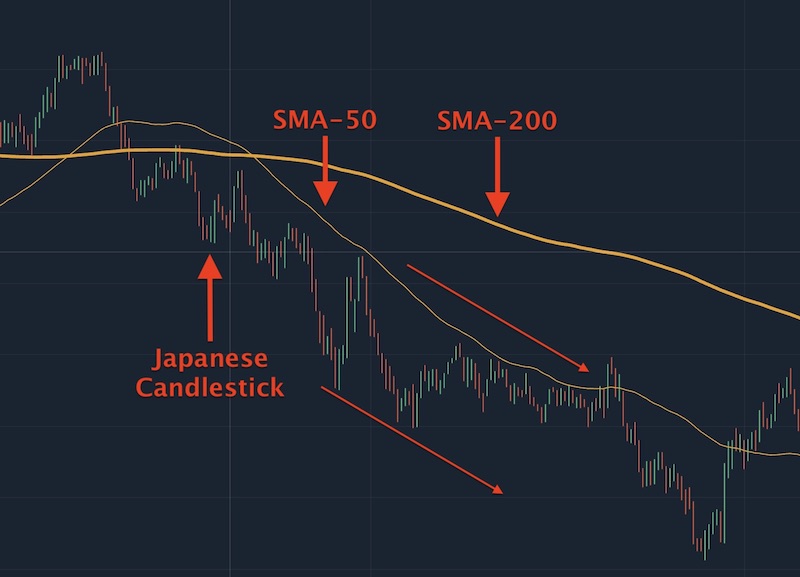
The price is in a downward when SMA-50 is above SMA-200 and price graph is above SMA-50 in the same direction
Combined with support and resistance
A combination of a long-term Simple Moving Average (SMA) such as the SMA-200 and a support/resistance area is a sign of a price trend guarantee over a period of time.
For example:
- The SMA-200 line is tending to increase, at the same time, the seams of the support areas tend to go up, showing that the price tends to increase sharply in the near future.
- With the downtrend of the SMA-200 with the seams of the resistance areas which are in a downtrend, it shows a bearish signal soon.
Signal interference
However, the price chart will be heavily disturbed by world news. For example, the COVID-19 epidemic or the George Floyd (I can’t breathe) rally occurred in 2020. Prices were chaotic and could not be used to determine the indicator. Traders can use their own experience to decide.
Register Olymp Trade & Get Free $10,000 Get $10,000 free for newbies
![]()
![]()
![]()
![]()
![]()


")
