Support and Resistance – How to find and how to use it
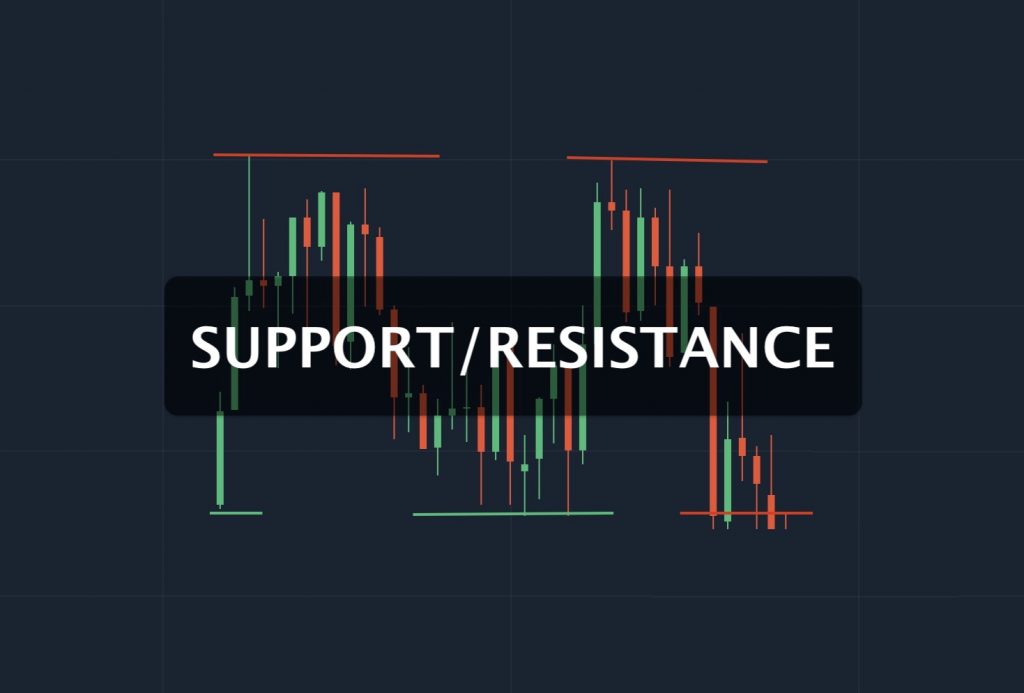
Support and Resistance indicators are basis patterns in technical analysis. Your new guys should learn about Support and Resistance first of all.
Support and Resistance indicators are basis patterns in technical analysis. Your new guys should learn about Support and Resistance first of all.
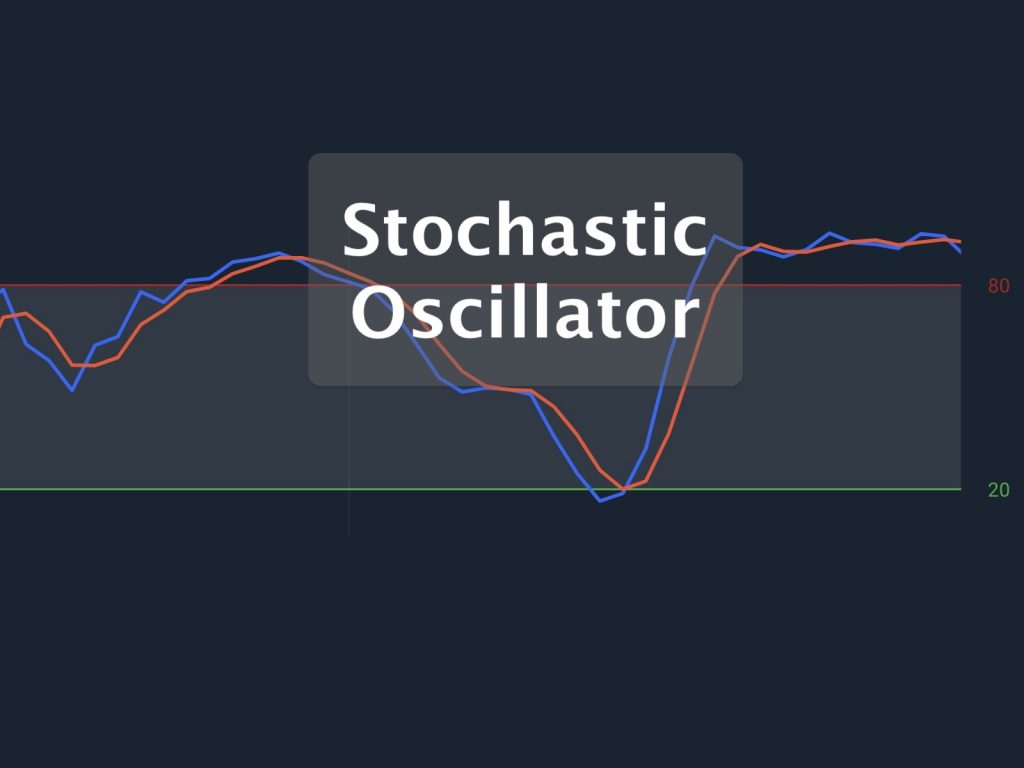
Stochastic Oscillator is an indicator that measures the fluctuation of asset prices in the range between the highest and lowest level of a fixed period.
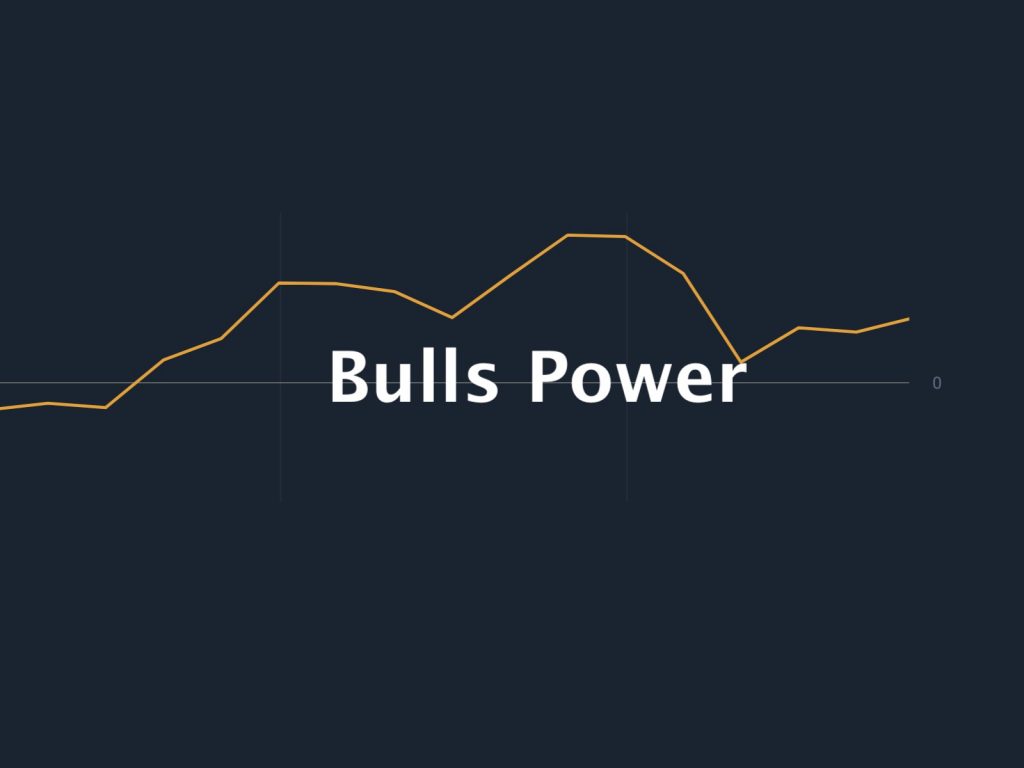
Bulls Power indicator is about the increasing signal. Bulls word means the headbutting of bull, raise to the top. Help your decision more accurate.
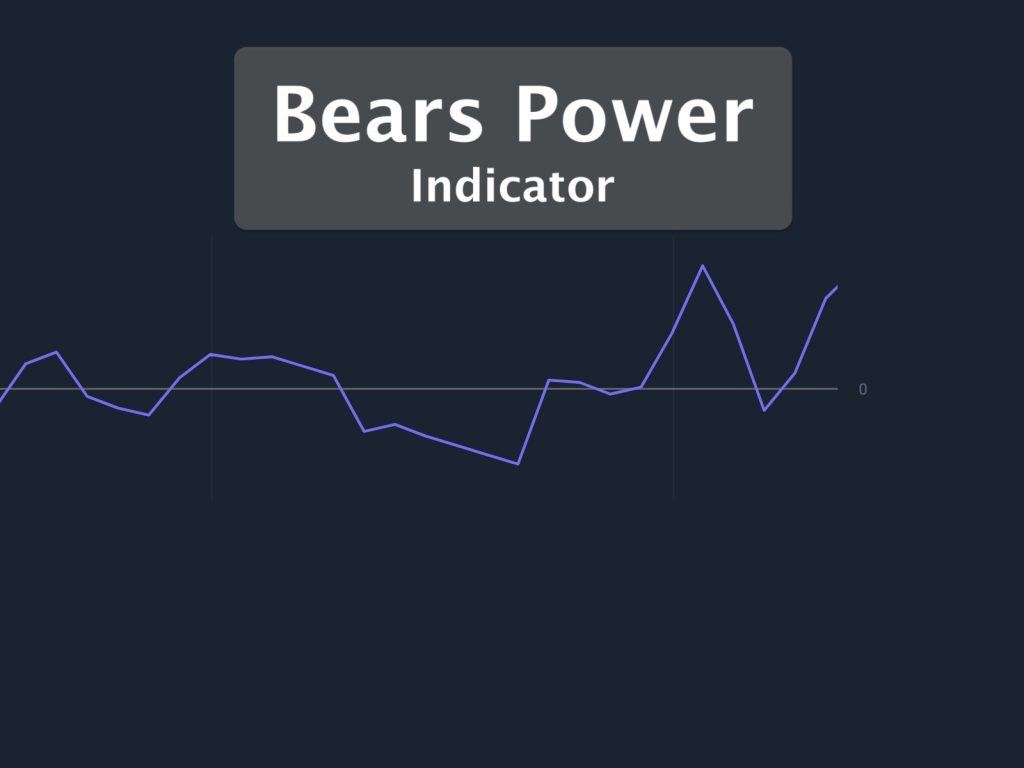
Bears Power Indicator determines the peak of the price graph and predicts the moment the price is going down. But it’s not a strong indicator.
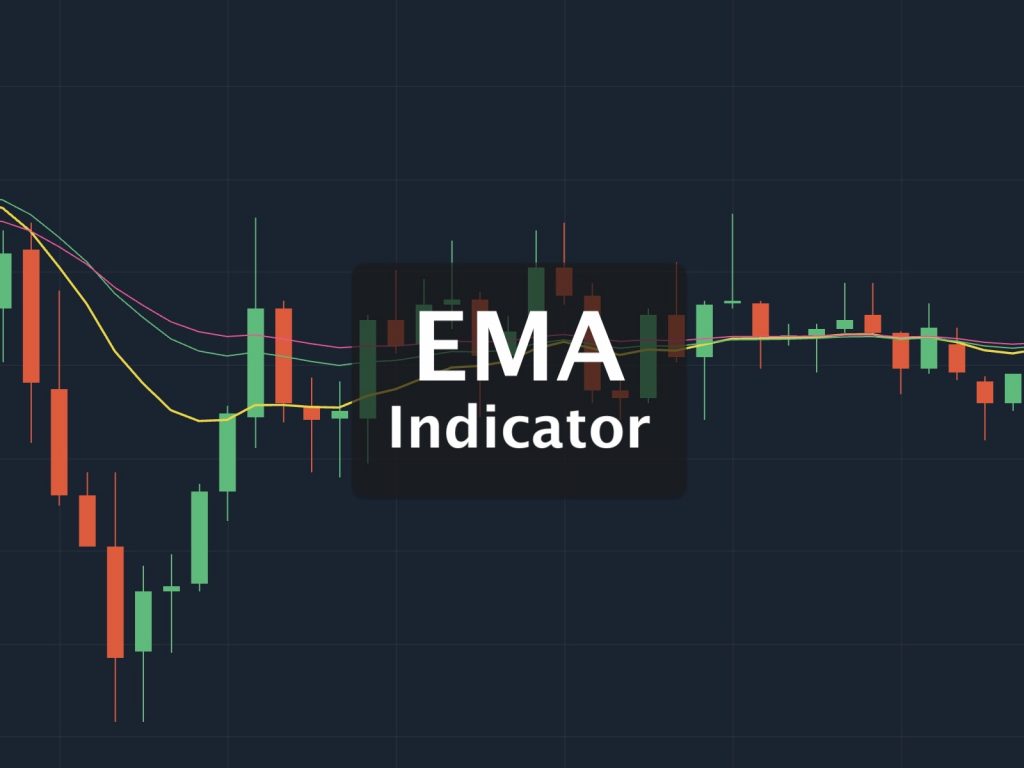
The EMA indicator is a basic tool that indicates whether the market is trending up, down, or stable. It’s commonly used as an essential tool for the newbie.
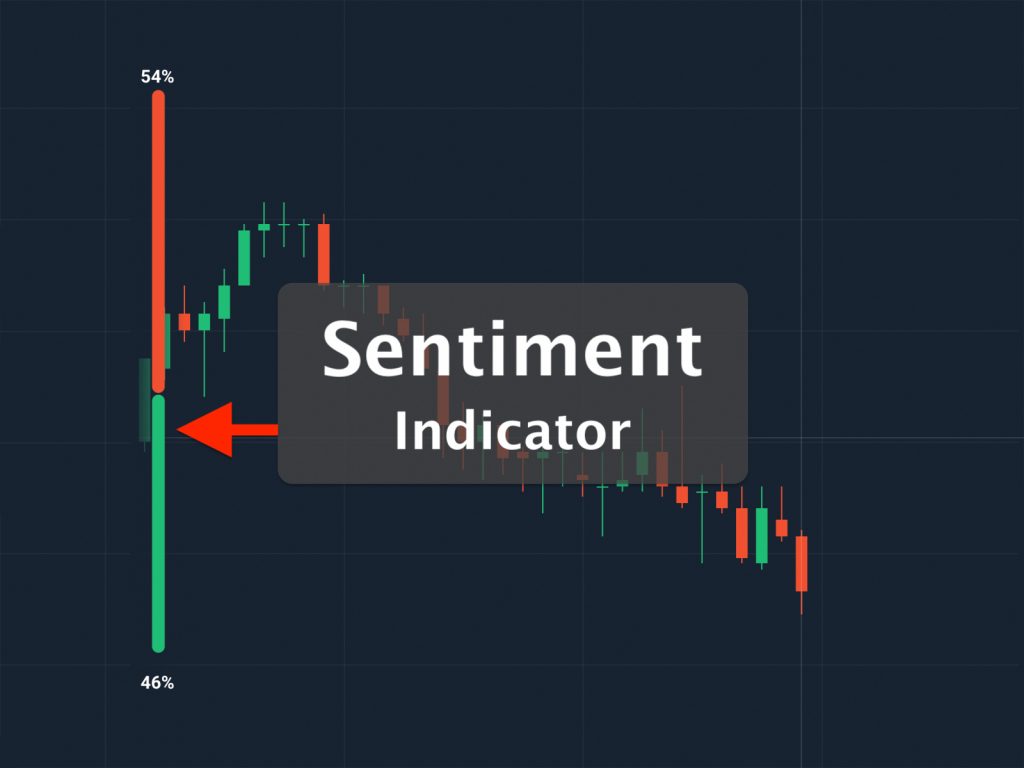
The Sentiment is a simple indicator, it shows the difference the whole floor between up and down by calculating the number of orders increased and decreased
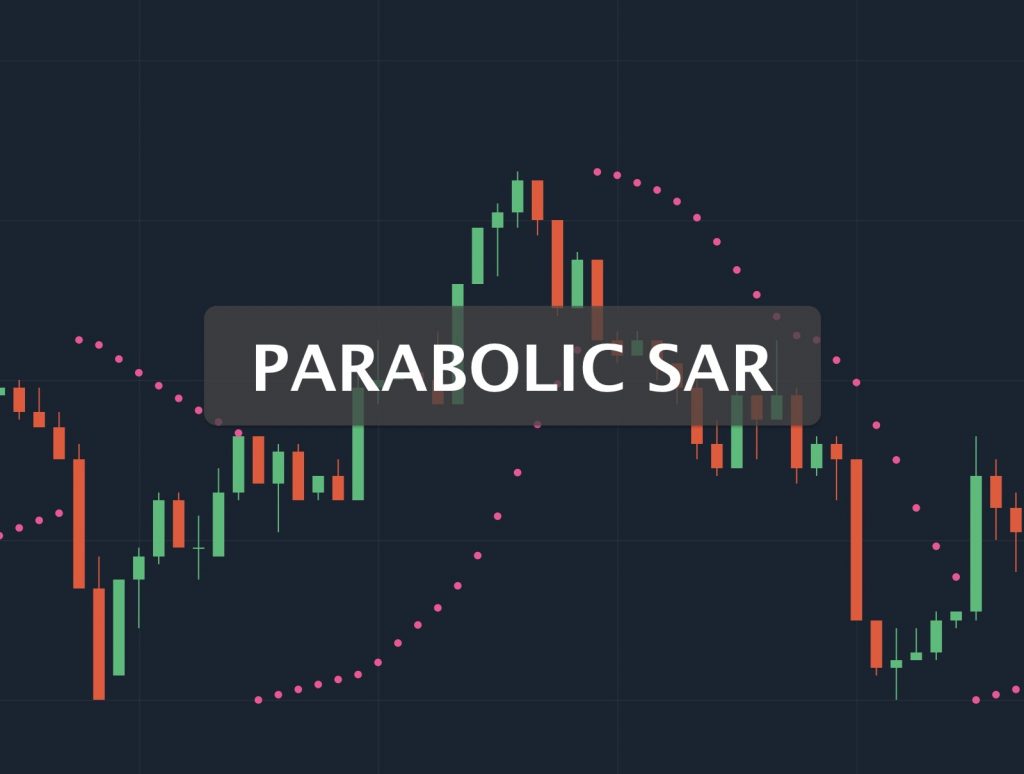
The Parabolic SAR (PSAR) indicator is used to monitor the trend of the asset’s rising/falling trend and also forecasts the price reversal.
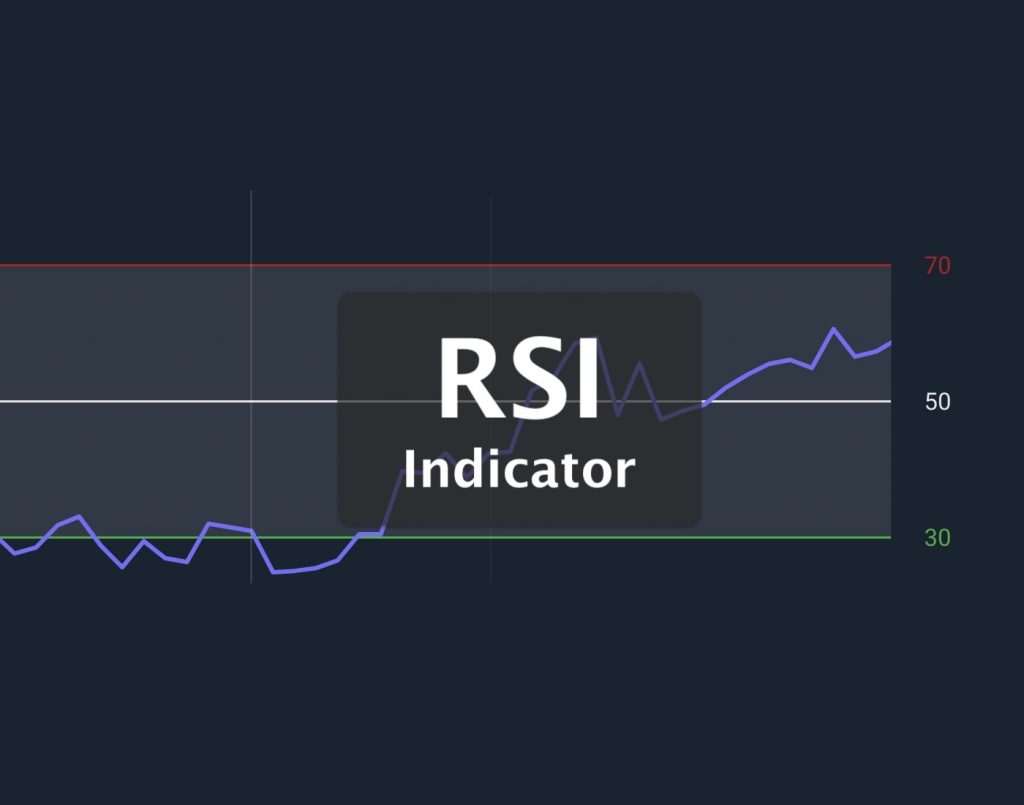
The Relative Strength Index (RSI) is a type of oscillator indicator used to alert trends that are about to begin to reverse.
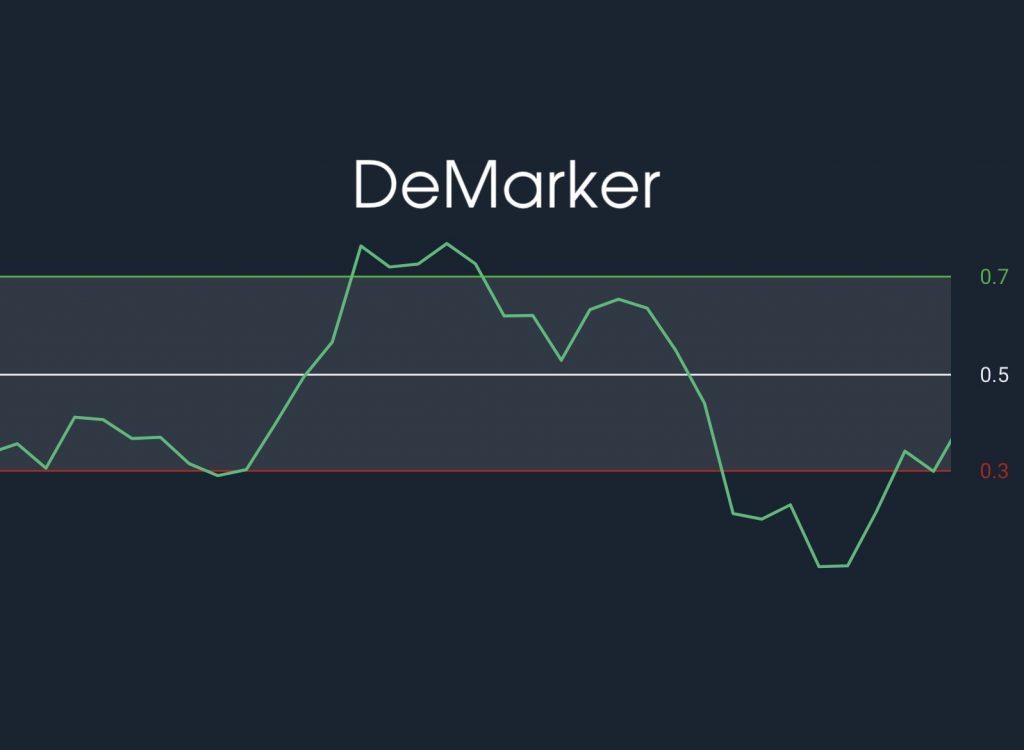
The DeMarker indicator is the basic indicators. If you wanna know what the DeMarker indicator is, this article will answer questions and guide read signals.
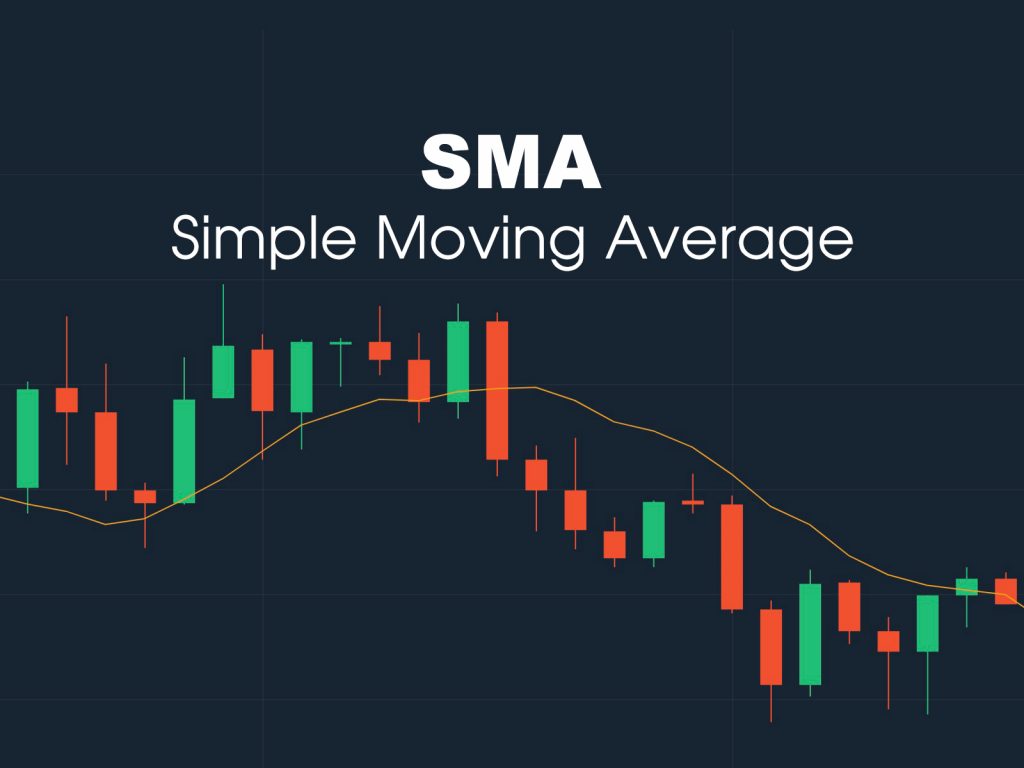
What is the Simple Moving Average (SMA) indicator? This article will show you how SMA can expect the price to change direction should buy or sell by signals
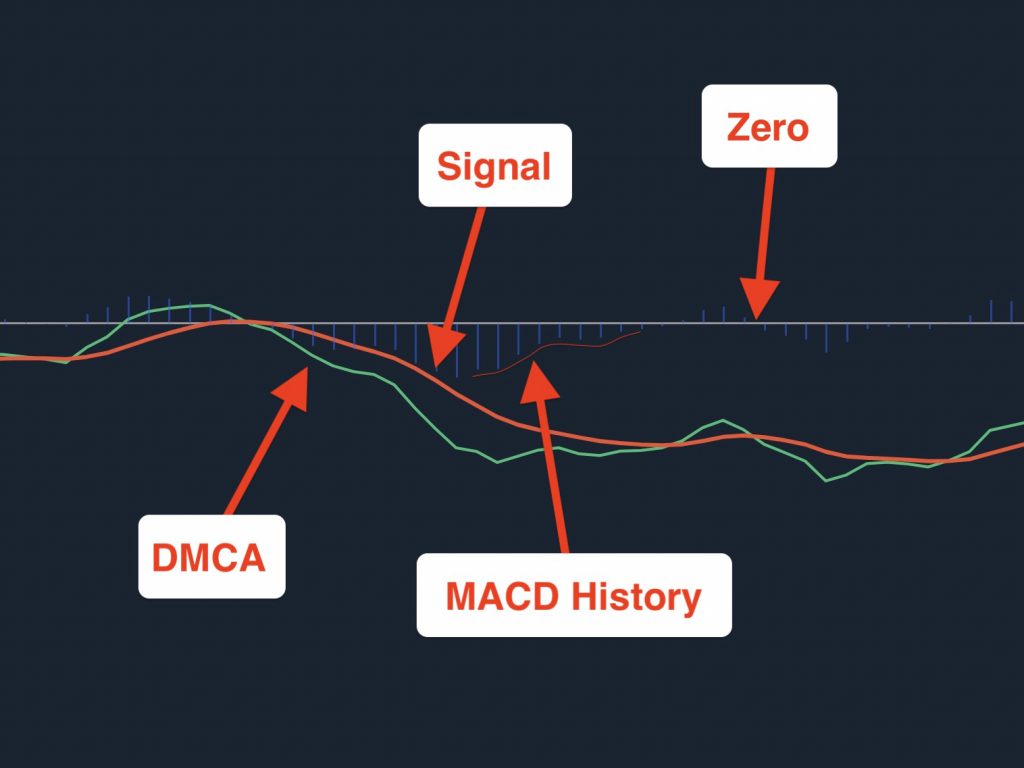
The MACD indicator shows the relationship between two moving averages line.. This article will help you notice the important things about MACD signal
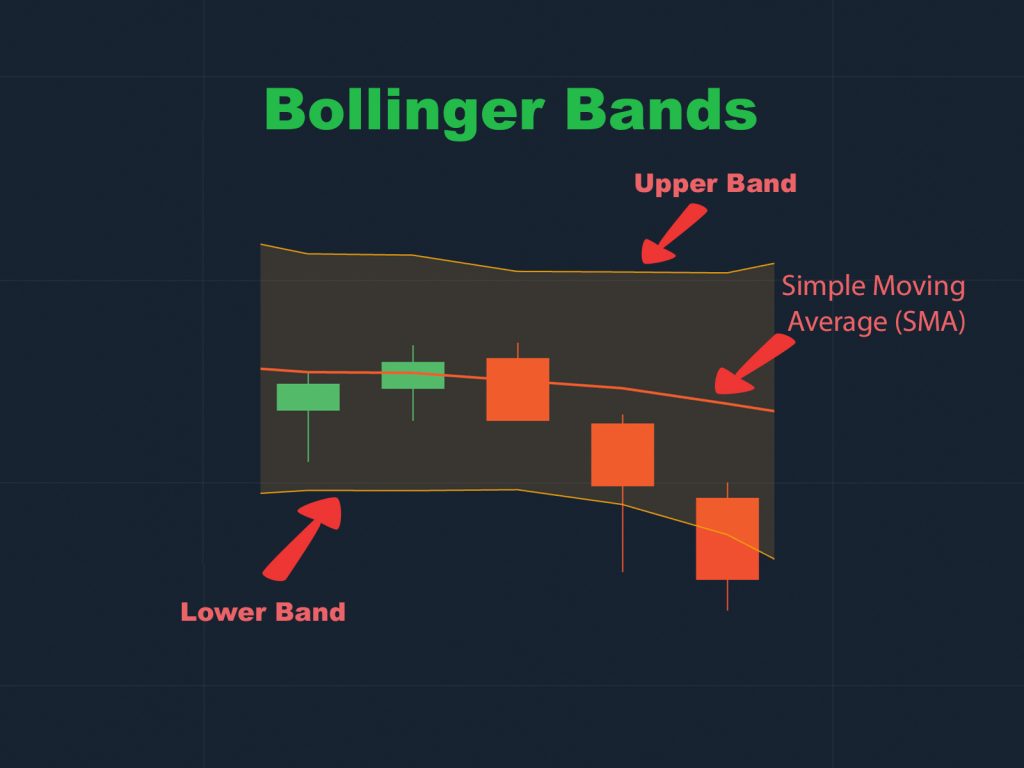
Bollinger Bands is a technical analysis tool which highly used by the investor. This article will help you know what Bollinger Bands is and how to use it.