Guide to use Parabolic SAR for Technical Analysis
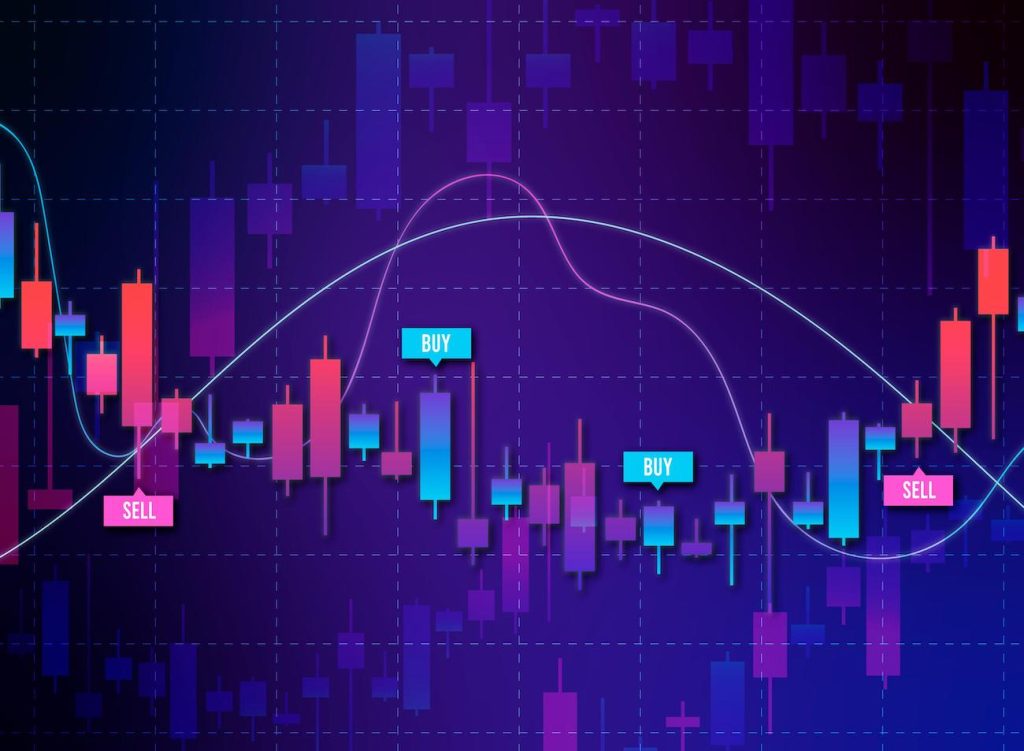
Parabolic SAR is an interesting tool that has a place in any strategy. Using this indicator, you can quickly determine a trend, the right time to buy an asset or close your trading positions
Parabolic SAR is an interesting tool that has a place in any strategy. Using this indicator, you can quickly determine a trend, the right time to buy an asset or close your trading positions

In this article, we discuss the functions, uses and features of the Alligator indicator and show how it looks on the chart.
All the necessary knowledge about the ADX index in securities has been synthesized by us through the this article. Through the article, investors have understood the concept of ADX indicator.

The Aroon indicator is used to determine market trends as well as the direction and strength of price movements.

StochRSI combines the best qualities of the two oscillators and identify overbought and oversold periods with greater accuracy.

The average daily range indicator is one of the best technical indicators in the financial markets. It uses a single calculation to detect market conditions and has become popular with short-term traders because of its accuracy.
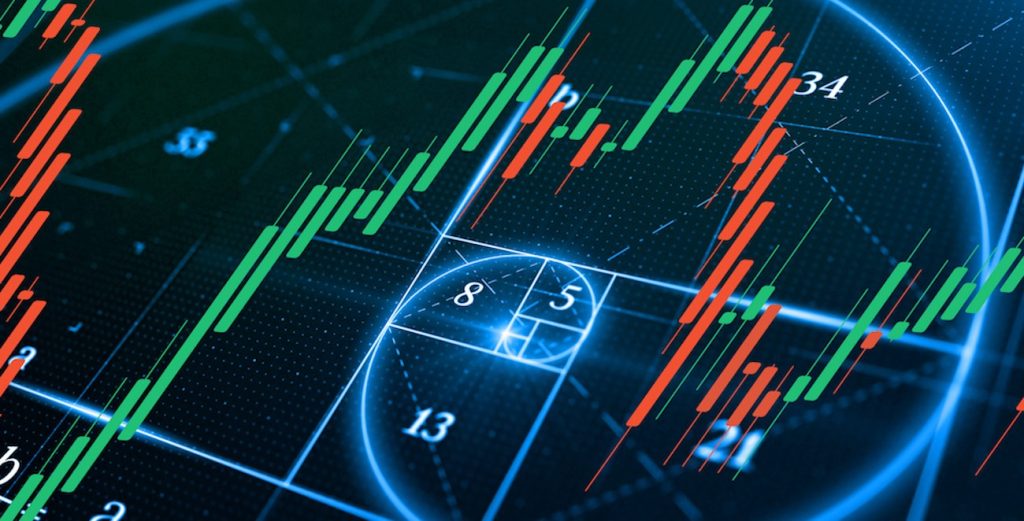
Here are the tools that you can use together with the Fibonacci indicators to maximize the overall efficiency of forecasting trends, find optimal market entry points, and reduce risks.
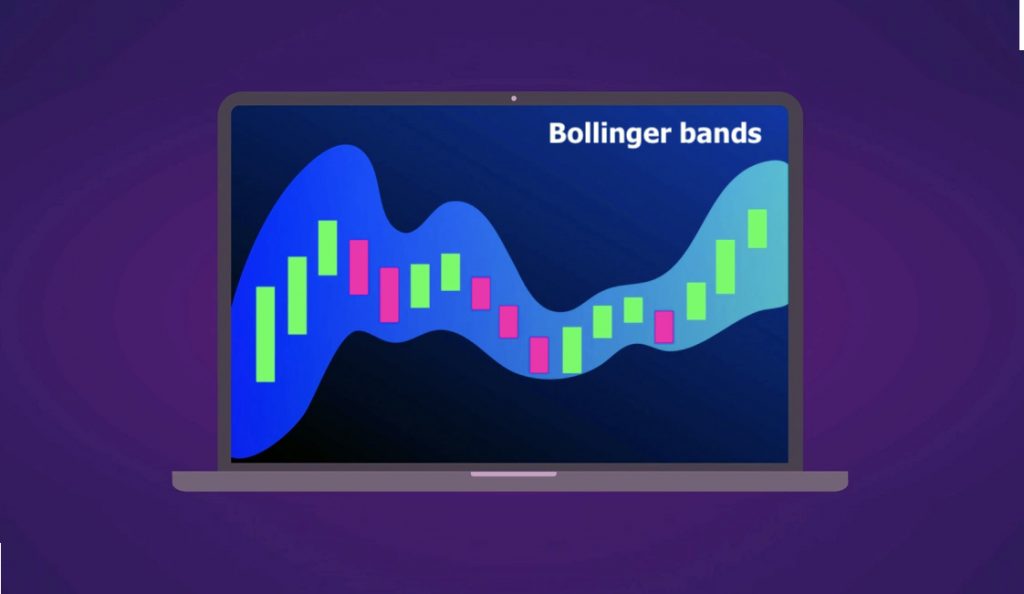
The Inversion Bollinger is the Bollinger Bands indicator turned into an oscillator, which is why it has both advantages and disadvantages over its predecessor.
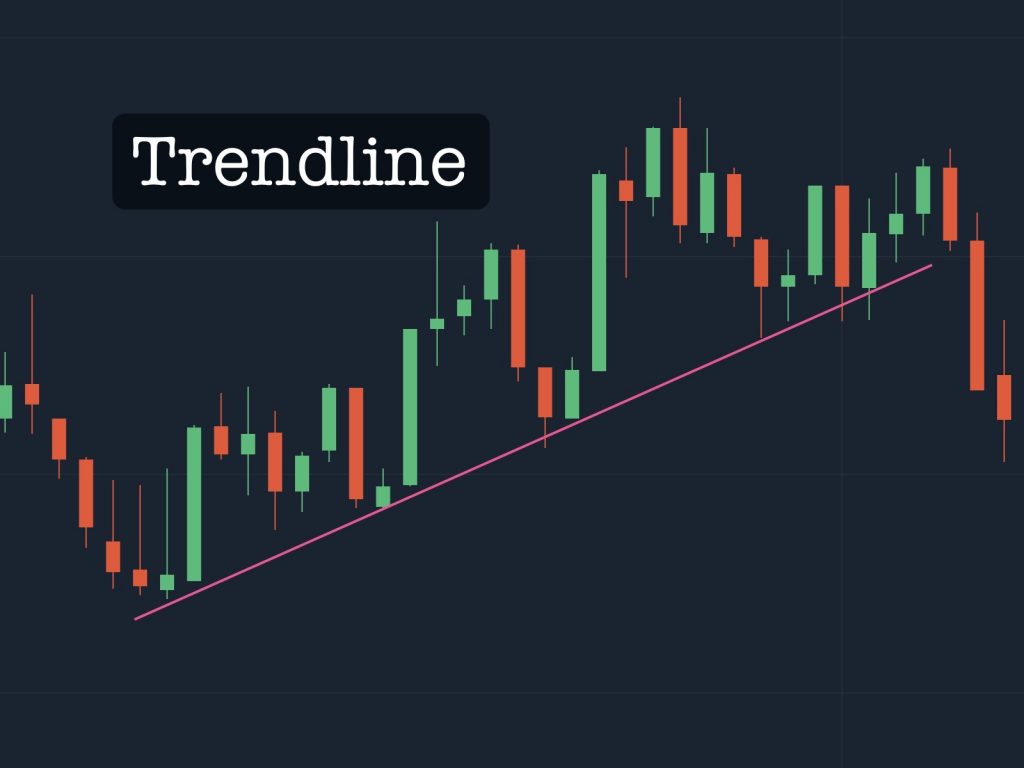
Trendline indicator is an extremely simple analytical indicator. That connect of two consecutive peaks or bottoms of a trend. Forming the market trend.
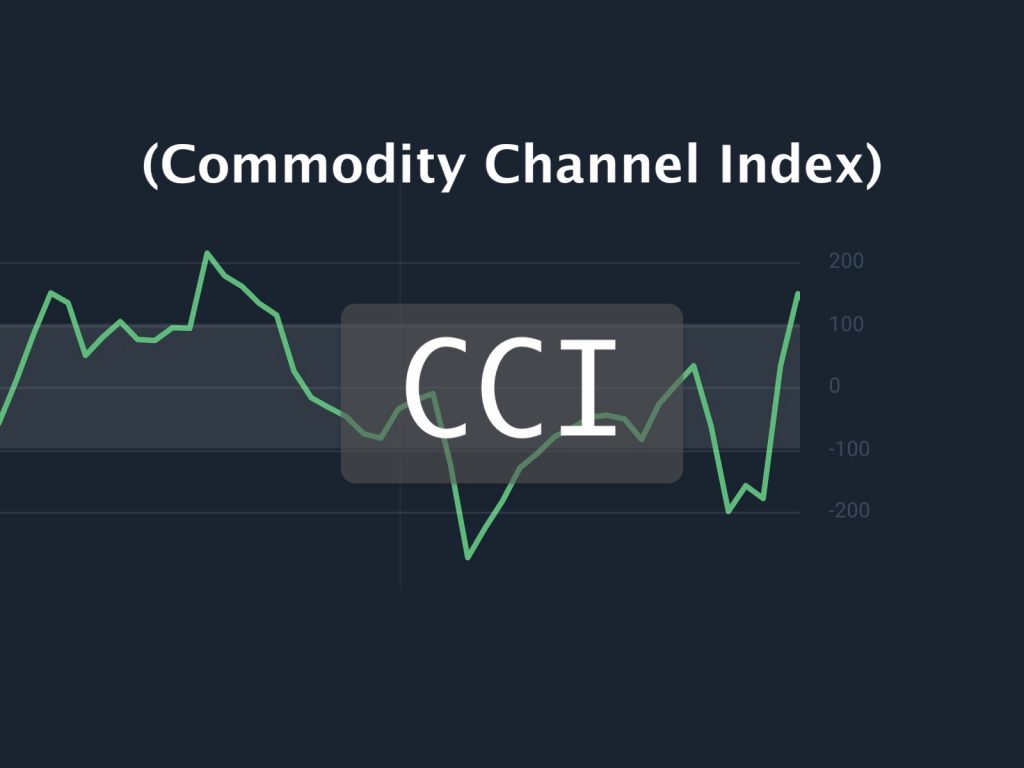
Technically, CCI oscillator measures the currently closed price relative to an average price over a given number of sessions. Help Traders have a good view.
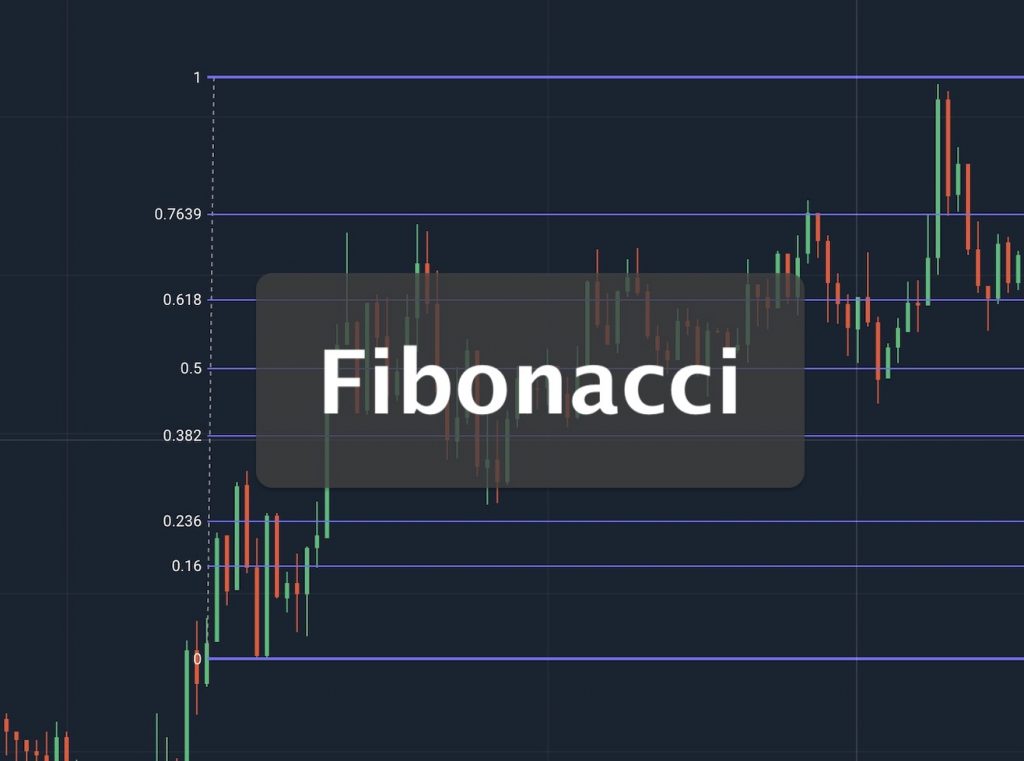
Fibonacci indicators have shapes such as retracement, fan, arc, extension,… It uses Fibonacci theory to draw supports and resistances with golden ratio.
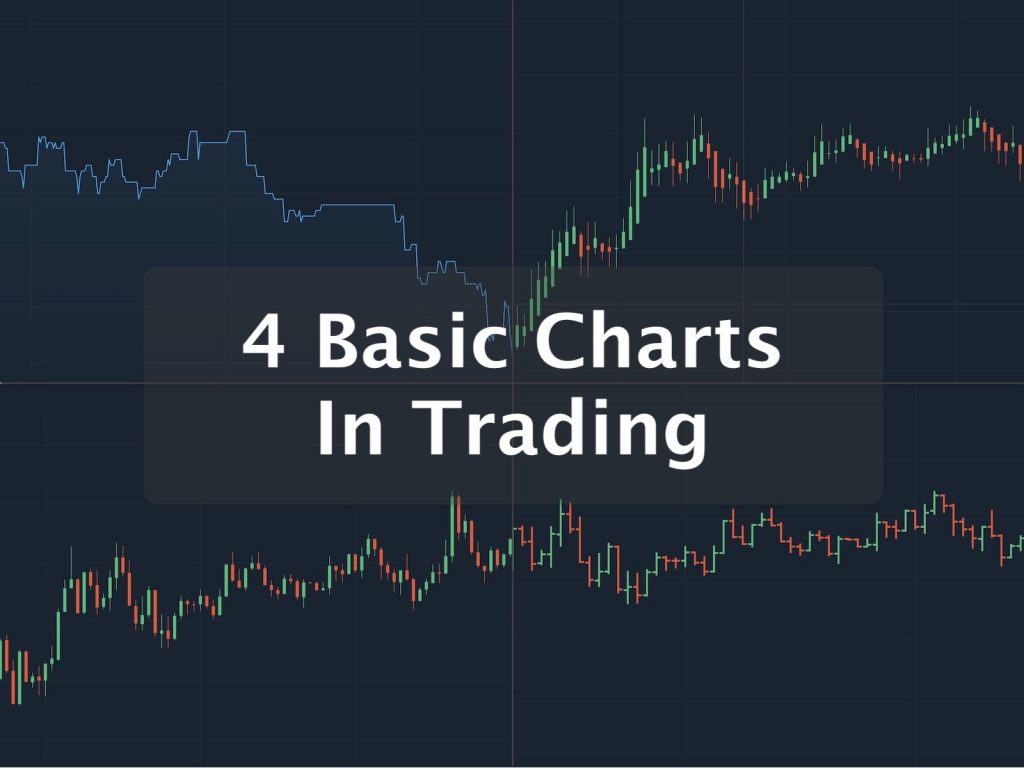
The four basic charts in technical analysis are the Japanese Candlesticks Chart, Heiken Ashi chart, Area chart, and Bar chart.
Zig Zag indicator is the link between the top and the bottom, creating ripples to show the trend of the market. This indicator is an emotional type.
Williams %R is an oscillator type mainly looking for overbought and oversold points of the market. It is a basic technical analysis for new guys.